Question
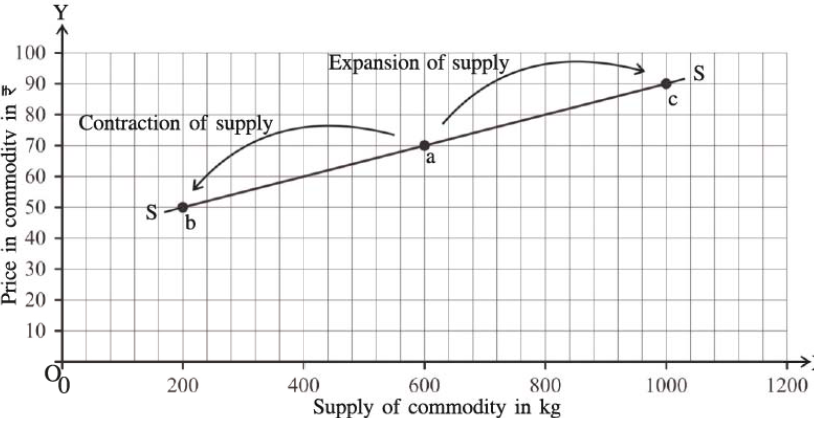
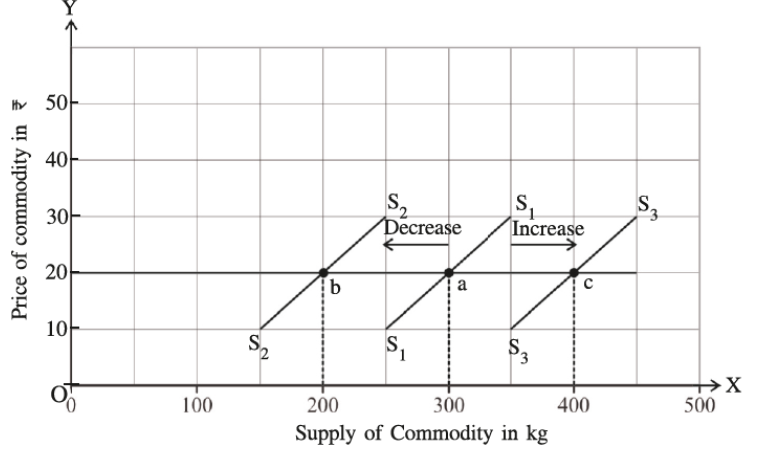
Explain the concept of expansion-contraction and increase-decrease in supply with the help of diagram.
| Price of x Commodity (Rs.) | The supply of x Commodity (Units) |
| $20$ $30$ $40$ $50$ $60$ |
$200$ $300$ $400$ $500$ $600$ |
| Price of apples in Rs. | Supply of apples in Kg. |
| 20 | 100 |
| 20 | 200 |
| 20 | 300 |
| 20 | 400 |
| 20 | 500 |
Generate a complete, print-ready paper with questions like this in minutes — across 16+ boards, with answer keys.