Question 12 Marks
Find the range and the coefficient of range of the marks from the following frequency distribution of marks scored by $50$ students of a school in a certain examination.
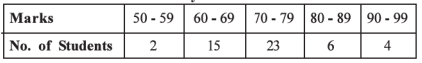
AnswerThe upper limit of the last class in $99$ and the lower limit of the first class is $50 .$
Hence, $x_{H}=99$ and $x_{L}=50$
Range $=x_{H}-x_{L}=99-50=49$
$\therefore \quad R=49$ Marks
Thus, range of the marks of students is $49$ marks.
$ \text { Coefficient of range } =\frac{R}{x_{H}+x_{L}}$
$=\frac{49}{99+50}$
$=\frac{49}{149}$
$=0.3289 $
$\therefore \quad$ Coefficient of range $=0.33$ Thus, coefficient of range of marks obtained by students is $0.33$.
View full question & answer→Question 22 Marks
The range and standard deviation of marks obtained out of $100$ in the first test by the students of a school are $80$ marks and $20$ marks respectively. These marks are divided by $4$ for the calculation of the internal marks. Find the range and standard deviation of the marks so obtained.
AnswerHere, if marks obtained out of $100$ are denoted by $x$ then Range $R_{x}=80$ marks and standard deviation $s_{x}=20$ marks. Now for the calculation of the internal marks these marks are divided by $4$.
Let us denote the marks so obtained by $y$. Thus $y=\frac{x}{4}=\frac{1}{4} x$.
So by using the results discussed earlier range and standard deviation of $y$ are obtained as follows:
Range $ R_{y}=\left|\frac{1}{4}\right| R_{x}=\frac{1}{4}(80)=20 \text { Marks } $
Standard deviation $s_{y}=\left|\frac{1}{4}\right| s_{x}=\frac{1}{4}(20)=5$ Marks
View full question & answer→Question 32 Marks
The items produced in a factory are packed into different boxes according to their weight. Using the following information, find the range and the relative range of weight of boxes :
| Weight (kg) |
Oct$-15$ |
$15-20$ |
$20-25$ |
$25-30$ |
$30-35$ |
| No. of boxes |
$8$ |
$15$ |
$26$ |
$47$ |
$4$ |
AnswerThe given frequency distribution is continuous. The upper limit of the last class and lower limit of the first class will be the highest and lowest observations of the data respectively.
Hence $x_{H}=35$ and $x_{L}=10$
Range $=x_{H}-x_{L}$
$ =35-10$
$=25$
$ \therefore R =25 \mathrm{kgs} .$
Thus, range of the weight of the boxes is $25 \mathrm{kgs}$.
$ \text { Relative range } =\frac{R}{x_{H}+x_{L}} $
$=\frac{25}{35+10} $
$=\frac{25}{45} $
$=0.5556 $
$ \therefore \text { Relative range } =0.56 $
Thus, relative range of the weight of the boxes is $0.56$.
View full question & answer→Question 42 Marks
The demand function of a commodity is $d=15-2 p$, where $p=$ price (in ₹) per unit and $d=$ demand (units). From the closing price of each month of the last year, it is known that for the price, range is $₹ 5$, mean deviation is $₹ 2$ and variance is $9(₹)^{2}$. Find range, mean deviation and variance of the demand from it.
AnswerHere, for price, Range $R_{p}=5 ₹$, Mean deviation $M D_{p}=2 ₹$ and variance $s_{p}^{2}=9(₹)^{2} .$
Now, the demand function is $d=15-2 p$. Using the results discussed earlier,
we get the following measures for the demand of the commodity :
Range $ R_{d}=|-2| \cdot R_{p}=2(5)=10$ units
Mean deviation $M D_{d}=|-2| \cdot M D_{p}=2(2)=4$ units
variance $ s_{d}^{2}=(-2)^{2} \cdot s_{p}^{2}=4(9)=36$ (units) $^{2}$
View full question & answer→Question 52 Marks
The range, quartile deviation mean deviation and standard deviation for a variable $x$ are $10, 2, 3$ and $5$ respectively. Ify $= 5x + 3$ find the range, quartile deviation, mean deviation and standard deviation for the variable $y.$
AnswerHere, For variable $x$, Range $R_{x}=10$, Quartile deviation $Q_{d x}=2$, Mean deviation $M D_{x}=3$, standard deviation $s_{x}=5$.
Now, $y=5 x+3$. Using the results discussed earlier, the measures of dispersion for the variable $y$ are obtained as follows.
Range $\quad R_{y}=|5| \cdot R_{x}=5(10)=50$ Quartile deviation $Q_{d y}=|5| \cdot Q_{d x}=5(2)=10$
Mean deviation $\quad M D_{y}=|5| \cdot M D_{x}=5(3)=15$
standard deviation $s_{y}=|5| \cdot s_{x}=5(5)=25$
View full question & answer→Question 62 Marks
The means and standard deviations of heights and weights of $50$ students of a class are as follows :
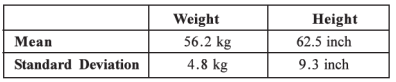
Where do you find more variation, among heights or weights? AnswerThe units of weights and heights are different here.
So, a relative measure of dispersion must be used for comparison and considering the given data, coefficient of variation is an appropriate measure.
Weight
$\bar{x}=56.2 \mathrm{~kg} s=4.8 \mathrm{~kg}$
Coefficient of Variation $-\frac{s}{x} \times 100$ $=\frac{4.8}{56.2} \times 100$
$=8.54 \%$
Height
$\bar{x}=62.5 \mathrm{~kg}, s=9.3$ inch Cueflicient of Variation $-\frac{s}{x} \times 100$ $=\frac{9.3}{62.5} \times 100$
$=14.88 \%$
Since the coefficient of variation is more for the heights, we say that height shows more variation.
View full question & answer→Question 72 Marks
The following information is available for two workers of a factory :
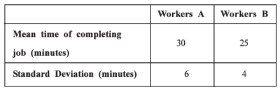
Which worker has more relative variation or fluctuation in the time taken to complete the job ?
AnswerFor the decision, coefficients of variation of both workers are to be compared.
worker A $\bar{x}=30$ minutes, $s=6$ minute
$\text { Coefficient of Variation } =\frac{s}{x} \times 100$
$=\frac{6}{30} \times 100$
$=20 \% $
worker B $\bar{x}=25$
minutes, $s=4$
minutes $ \text { Coefficient of Variation } =\frac{s}{x} \times 100$
$=\frac{4}{25} \times 100$
$=16 \% $
Since the coefficient of variation of worker A is more, there is more variation in the time taken by worker A to complete the job.
View full question & answer→Question 82 Marks
From the following information of monthly salary (in $2'$) of workers of a factory, find the range and the coefficient of range of the salary.
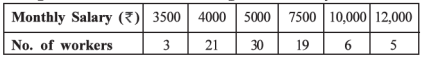
AnswerThe variable (monthly salary) of the frequency distribution is discrete and from the observations of salary it is clear that $x_{\mathrm{H}}=12,000$ and $x_{\mathrm{L}}=3500$
$ \text { Range } =x_{H}-x_{L} $
$=12,000-3500 $
$=8500 $
$\therefore R=₹ 8500 $
Thus, the range of the monthly salary of workers is $₹ 8500$.
$ \text { Coefficient of range } =\frac{R}{x_{H}+x_{L}} $
$=\frac{8500}{12000+3500} $
$=\frac{8500}{15500} $
$=0.5484 $
$ \therefore \text { Coefficient of range }=0.55 $
Thus, the coefficient of range of the monthly salary of workers is $0.55$.
View full question & answer→Question 92 Marks
The following are closing prices (in $2'$) of $S$ shares :
$132, 147, 120, 152, 125$
Find the standard deviation by short-cut method.
AnswerWe take assumed mean $A = 135$
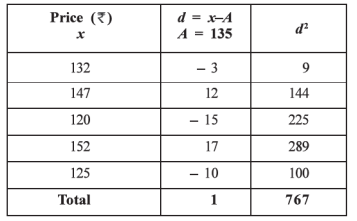
Standard Deviation
$ s =\sqrt{\frac{\Sigma d^{2}}{n}-\left(\frac{\Sigma d}{n} !^{2}\right.}$
$ =\sqrt{\frac{767}{5}-\left(\frac{1}{5} !^{2^{2}}\right.}$
$ =\sqrt{153.4-0.04}$
$ =\sqrt{153.36}$
$ =12.3839$
$\therefore s =₹ 12.38 $
Thus, the standard deviation of price of share is $₹ 12.38$. View full question & answer→Question 102 Marks
The runs scored by a batsman in his last $10$ innings of cricket matches are $48, 75, 37, 52, 93, 81, 25, 72, 18$ and $60$. Find the range and the coefficient of range of his runs.
AnswerHere, $x_{H}=93, x_{L}=18$
Hence Range $=x_{H}-x_{L}=93-18=75$
$\therefore R=75$ runs
Thus, the range of runs scored in last ten innings is $75$ runs.
$ \text { Coefficient of range } =\frac{R}{x_{H}+x_{L}}$
$=\frac{75}{93+18}=\frac{75}{111}=0.6757 $
$\therefore \quad$ Coefficient of range $x=0.68$
Thus, the coefficient of range of runs is $0.68$.
View full question & answer→Question 112 Marks
Find the standard deviation for the observations $1, 2, 3, 4, 5.$
AnswerHere,$n=5$
$X: 1,2,3,4,5$
$\therefore \bar{x}=\frac{1+2+3+4+5}{5}=\frac{15}{5}=3$
$(x-\bar{x}):-2,-1,0,1,2 \therefore \Sigma(x-\bar{x})=0$
$(x-\bar{x})^2: 4,1,0,1,4 \sum(x-\bar{x})^2=10$
Standard deviation :
$s=\sqrt{\frac{\sum(x-\bar{x})^2}{n}}=\sqrt{\frac{10}{5}}=\sqrt{2}=1.41$
View full question & answer→Question 122 Marks
If $\overline{ x }=25$ and the coefficient of variation is $20 \%$, find the variance.
Answer$\bar{x}=25$, coefficient of variation $=20 \%$, variance $s^2=$ ?
Coefficient of variation $=\frac{8}{x} \times 100$
$\therefore 20=\frac{s}{25} \times 100$
$\therefore 20=4 s$
$\therefore s =\frac{20}{4}=5$
Hence, variance $=s^2=(5)^2=25$
View full question & answer→Question 132 Marks
Find the mean deviation for the observations $: 3, 8, 1, 7, 6$
AnswerHere,$n=5$
$X: 3,8,1,7,6$
$\therefore$ Mean $\bar{x}=\frac{3+8+1+7+6}{5}=\frac{25}{5}=5$
$\sum|x-\bar{x}|=2+3+4+2+1$
Mean deviation $MD =\frac{2|x-\bar{x}|}{n}=\frac{12}{5}=2.4$
View full question & answer→Question 142 Marks
Find the coefficient of quartile deviation for the observations :
$8, 15, 2, 11, 20, 3, 5$
AnswerWriting observations in ascending order $2,3,5,8,11,15,20$
Here, $n=7$
First quartile :
$Q _1=$ value of $\left(\frac{ n +1}{4}\right)$ th observation
$=$ value of $\left(\frac{(7+1)}{4}\right)=2^{\text {nd }}$ observation $=3$
Third Quartile :
$Q _3=$ Value of $3\left(\frac{ n +1}{4}\right)$ th observation
$=$ Value of $3(2)=6$ th observation
Coefficient of quartile deviation :
Coefficient of $Q_d=\frac{Q_s-Q_1}{Q_s+Q_1}=\frac{15-3}{15+3}=\frac{12}{18}=\frac{2}{3}=0.67$
View full question & answer→Question 152 Marks
Find the range and the coefficient of range for the observation $6, 11, -3, 0, 8.$
AnswerObservations x : $6,11,-3,0,8$
Here, $X_H=11 ; X_L==-3$
Range $R = X _{ H }- X _{ L }=11-(-3)=11+3=14$
Coefficient of range :
Coefficient of range $=\frac{ R }{ xH + xL }=\frac{14}{11-3} \frac{14}{8}=1.75$
View full question & answer→Question 162 Marks
Which measures of dispersion are based on the deviations of observation from their mean ?
AnswerMean Deviation and standard deviation are the measures of dispersion based on the deviations of deviations from their mean.
View full question & answer→Question 172 Marks
Write names of the absolute measures of dispersion.
AnswerThe absolute measures of dispersion are : $(1)$ Range $(2)$ Quartile deviation, $(3)$Mean deviation and $(4)$ Standard deviation.
View full question & answer→Question 182 Marks
What is meant by the absolute and relative measures of dispersion ?
Answer
- The Absolute Measure of Dispersion : A measure of dispersion expressed in the same units in which the observations of the data are expressed. is called an absolute measure of dispersion. If the unit of the observations of the data is cm. the absolute measure of dispersion is expressed in cm. It cannot be used for comparing the dispersion of two or more groups with different units.
- The Relative Measure of Dispersion : A measure of dispersion which is free from the unit of measurement is called the relative measure of dispersion. The variability of two or more sets of data having different unit of measurement can be compared by relative measure of dispersion. It is the ratio of the absolute measure of dispersion and the measure of average, i.e.,
- Relative measure of dispersion $=\frac{absolute \ measure \ of \ dispersion}{average}$
View full question & answer→Question 192 Marks
The $25$th and the $75$th percentiles of a data set are $20$ and $36$ respectively. Find the coefficient of quartile deviation of the data set.
Answerhere, $P _{25}=20 \therefore Q _1=20\left(\because P _{25}= Q _1\right)$
$P _{75}=36 \therefore Q _3=36\left(\because P _{75}= Q _3\right)$
Coefficient of quartile deviation:
Coefficient of $Q _{ d }=\frac{ Q 3- Q 1}{ Q + Q 1}=\frac{36-20}{36+20}=\frac{16}{56}=0.29$
View full question & answer→Question 202 Marks
Which of the following factories is more stable with respect to daily production ?
| |
Factory $A$ |
Factory $B$ |
| Average Daily production (units) |
$50$ |
$48$ |
| Standard deviation (units) |
$10$ |
$12$ |
Answer
- We will determine the stability of factory in context to daily production by comparing the coefficient of variation of daily production of Factory $A$ and Factory $B.$
- Factory $A :$
- $\overline{ x }=$ Average daily production $=50$
- $s=$ Standard deviation $=10$
- Coefficient of variation $=\frac{s}{x} \times 100=\frac{10}{50} \times 100=20 \%$
- Factory $B:$
- $\overline{ x }=$ Average daily production $=48$
- $s=$ Standard deviation $=12$
- Coefficient of variation $=\frac{8}{x} \times 100=\frac{12}{48} \times 100=25 \%$
- The coefficient of variation of daily production of factory $A$ is less than that of factory $B$. Hence, the daily production of factory $A$ is more stable.
View full question & answer→Question 212 Marks
Define the following :
$(i)$ Mean Deviation $(ii)$ Standard Deviation $(iii)$ Coefficient of Variation
Answer$(i)$ Mean Deviation: The mean of the absolute deviations of a data from its mean is called deviation and it is denoted by $MD.$
$(ii)$ Standard Deviation : Standard deviation is the positive square root of the mean of the Squares of the deviations measured from the mean. It is denoted by $‘s’.$
$(iii)$ Coefficient of Variation: Coefficient of Variation is the percentage measure of standard deviation in relation to the mean.,$ i.e.,$ Coefficient of Variation $=\frac{S}{X}X$100.
View full question & answer→Question 222 Marks
The daily salary of administrative staff of two companies yielded the following results:
| |
Company A |
Company B |
| Mean salary(₹) |
$600$ |
$2100$ |
| Standard Deviation (₹) |
$30$ |
$84$ |
Which company has more stable salary? AnswerCompany $A$
$ \bar{x}=₹ 600$
$s=₹ 30 $
$ \text { Coefficient of variation }=\frac{8}{x} \times 100$
$=\frac{30}{600} \times 100$
$=5 \% $
Company B:
$ \bar{x}=₹ 2100$
$s=₹ 84 $
$ \text { Coefficient of variation }=\frac{8}{\bar{x}} \times 100$
$=\frac{84}{2100} \times 100$
$=4 \% $
The coefficient of variation of daily salary of employees of company $A$ is $5 \%$ and that of company $B$ it is $4 \%$.
Hence, the daily salary in company $B$ Is more stable.
View full question & answer→Question 232 Marks
The numbers of cars coming for service in five service stations of a company on a particular day are $7, 3, 11, 8, 9$. Calculate the standard deviation of number of cars coming at the service station.
AnswerHere, $n = 5$
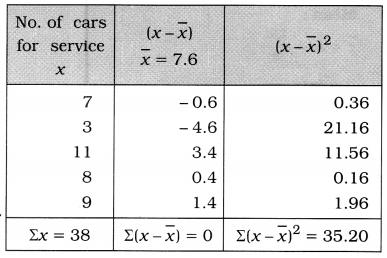
Mean :
$ \overline{\mathrm{X}}=\frac{\Sigma x}{n} $
$ =\frac{38}{5} $
$=7.6 \text { Cars }$
Standard deviation of number of cars for service:
$S=\sqrt{\frac{\Sigma(x-\bar{x})^2}{n}}$
$=\sqrt{\frac{35.20}{5}} $
$=\sqrt{7.04}$
$ =2.65 \text { cars }$ View full question & answer→Question 242 Marks
The marks obtained by $9$ students in a test of $100$ marks in Mathematics are given below: $64, 63, 72, 65, 68, 69, 66, 67, 69$ Find the standard deviation of marks obtained by the students.
AnswerHere $n = 9$
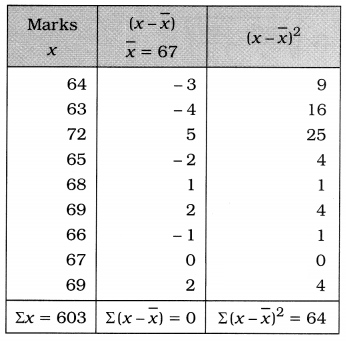
Mean:
$\overline{\mathrm{x}}=\frac{\Sigma x}{n}=\frac{603}{9}=67 \text { marks }$
Standard deviation of marks:
$s =\sqrt{\frac{\Sigma(x-\bar{x})^2}{n}} $
$ =\sqrt{\frac{64}{9}} $
$ =\sqrt{7.111} $
$ =2.67 \text { marks }$ View full question & answer→Question 252 Marks
The frequency distribution of daily income (in thousand ₹) of $80$ shops of an area is as follows. Find the absolute and the relative measure of range of daily income from it.
| Daily income (thousand ₹) |
$5-9$ |
$10-14$ |
$15-19$ |
$20-24$ |
$25-29$ |
$30-34$ |
| No. of shops |
$11$ |
$20$ |
$17$ |
$13$ |
$12$ |
$7$ |
AnswerHere, $x_{H}=$ Upper limit of the last class $30-34=₹ 34$
$X_{L}=$ Lower limit of the initial class $5-9=₹5$
Absolute measure of range of age:
$R=X_{H}-x_{L}$
$=34-5=₹ 29 \text { thousand }$
Relative measure of range of age:
Coefficient of range $=\frac{x_{\mathrm{H}}-x_{\mathrm{L}}}{x_{\mathrm{H}}+x_{\mathrm{L}}}=\frac{\mathrm{R}}{x_{\mathrm{H}}+x_{\mathrm{L}}}$
$ =\frac{29}{34+5}$
$=\frac{29}{39}$
$=0.74 $
View full question & answer→Question 262 Marks
Using the following frequency distribution of marks of students of a school, find the range and relative range of the marks.
| Marks |
$20-30$ |
$30-40$ |
$40-50$ |
$50-60$ |
$60-70$ |
$70-80$ |
| No. of Students |
$8$ |
$20$ |
$25$ |
$60$ |
$45$ |
$10$ |
AnswerHere, $x_{H}=$ Upper limit of the last class $70-80=80$ marks $x_{L}=$
Lower limit of the initial class $20-30=20$ marks
Range of marks of students :
$ R=x_{H}-x_{L}$
$=80-20=60 \text { marks } $
Relative range of marks:
Relative range $=\frac{\mathrm{R}}{x_{\mathrm{H}}+x_{\mathrm{L}}}$
$ =\frac{60}{80+20}$
$=\frac{60}{100}$
$=0.60 $
View full question & answer→Question 272 Marks
A bus company has $77$ buses for travelling in the city. The information of number of passengers in bus on a particular day at a particular time is given below. Find the range and coefficient of range of a number of passengers.
| No. of Passengers |
$2$ |
$7$ |
$10$ |
$18$ |
$25$ |
$30$ |
$37$ |
| No. of Buses |
$1$ |
$4$ |
$11$ |
$17$ |
$23$ |
$16$ |
$5$ |
AnswerHere. $X_{H}=$ Maximum passengers travelling in a bus $=37$
$X_{L}=$ Minimum passengers travelling in a bus $=2$
Range of number of passengers: $R=x_{H}-x_{L}$
$=37-2$
$=35$ Passengers
$ \text { Coefficient of range }=\frac{\mathrm{R}}{x_{\mathrm{H}}+x_{\mathrm{L}}}$
$=\frac{35}{37+2}$
$=\frac{35}{39}$
$=0.90 $
View full question & answer→Question 282 Marks
The sum of $25$ observations is $120$ and the sum of squares of their deviations from mean is $240$, find the coefficient of variance.
View full question & answer→Question 292 Marks
If the sum of positive deviations of $50$ observations from their mean is $112$, find the mean deviation.
View full question & answer→Question 302 Marks
For a frequency distribution of $100$ observations if $\sum f x=1200$ and $\sum f|x-\bar{x}|=289$, find the coefficient of mean deviation.
Answer$\bar{x}=12$, M.d. $=2.89$, Coefficient of M.d. $=0.24$
View full question & answer→Question 312 Marks
Find the coefficient of mean deviation for the observations $2.1, 2.5, 2.6, 2.7, 3.1.$
Answer$\bar{x}=2.6, M.d. =0.24$, Coefficient of $M.d. =0.09$
View full question & answer→Question 322 Marks
If mean deviation $=\frac{3}{5}$ (Mean), find the coefficient of mean deviation.
View full question & answer→Question 332 Marks
The sum of $20$ observations is $520$ . If the sum of positive deviations of observations from their mean is $320$ , find the coefficient of mean deviation.
View full question & answer→Question 342 Marks
The coefficient of mean deviation for $10$ observations is $0.5$. If its mean deviation is $12.5$, find the sum of $10$ observations.
Answer$\bar{x}=25, \sum x=250$
View full question & answer→Question 352 Marks
The quartile deviation of a data is $7.5$. If $Q_{1}=25$, find $Q_{3}$
View full question & answer→Question 362 Marks
For a data, the quartile deviation and the coefficient of quartile deviation are in - the proportion of $20: 1$. If $Q_{1}$ $=15$, find $Q_{3}$.
View full question & answer→Question 372 Marks
Find the quartile deviation of observations $9,9,9,9,9,9,9$.
View full question & answer→Question 382 Marks
If $3\left(Q_{3}+Q_{1}\right)=5\left(Q_{3}-Q_{1}\right)=120$, find thequartile deviation and its coefficient.
Answer$Q_{d}=12 ;$ Coefficient of $Q_{d}=0.6$
View full question & answer→Question 392 Marks
If $2 Q_{3}=5 Q_{1}=60$, find the quartile deviation.
View full question & answer→Question 402 Marks
If the quartile deviation is $7$ and the coefficient of quartile deviation is $0.4$ for a frequency distribution, then find the quartiles.
Answer$Q_{1}=10.5, Q_{3}=24.5$
View full question & answer→Question 412 Marks
If the first quartile of a frequency distribution is $\frac{2}{3}$ times its third quartile, find the coefficient of quartile deviation.
View full question & answer→Question 422 Marks
The coefficient of quartile deviation of a data is $0.5$. If its third quartile is $65$ , find the first quartile.
View full question & answer→Question 432 Marks
For a group of $100$ observations the sum of two extreme quartiles is $120$ and their difference is $24$ , find the quartile deviation and its coefficient.
Answer$Q_{d}=12$, Coefficient of $Q_{d}=0.2$
View full question & answer→Question 442 Marks
In an ungrouped data $25 \%$ of observations is less than 28 and $25 \%$ of observations is more than $32$ , find the coefficient of quartile deviation.
View full question & answer→Question 452 Marks
For a frequency distribution if $Q_{1}=17.4, Q_{3}=36.6$, find quaritile deviation and coefficient of quartile deviation.
Answer$Q_{d}=9.6$, Coefficient of $Q_{d}=0.36$
View full question & answer→Question 462 Marks
If the relative range is $0.44$ and $X_{L}=28$, find $X_{H}$.
View full question & answer→Question 472 Marks
If $X_{H}=-4$ and $X_{L}=-12$, find the range and relative range.
Answer$\mathrm{R}=8$, relative range $=-0.5$
View full question & answer→Question 482 Marks
The relative range of a data is $0.25$ and the largest observation is $40$, find the smallest observation. .
View full question & answer→Question 492 Marks
The height of the tallest student of a class is $172 \ cm$ and that of the shortest student It is $138 \ cm$. Find the coefficient of range.
View full question & answer→Question 502 Marks
Find variance of observations $11, 20, 29, 38, 52.$
View full question & answer→