Question 12 Marks
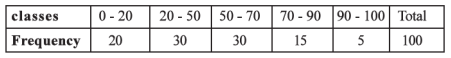
The following frequency distribution of unequal class length is obtained for some
data. Prepare a frequency distribution stating class length and mid value of each class.
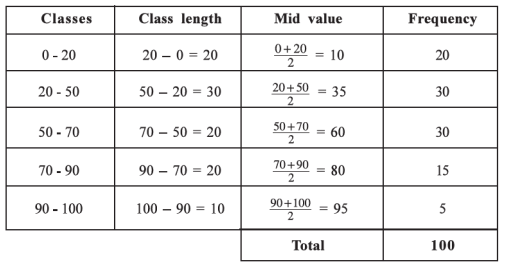
AnswerA frequency distribution showing mid value and class length of each class is as under :
View full question & answer→Question 22 Marks
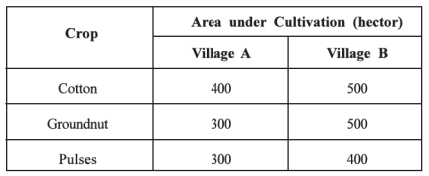
The data regarding area under cultivation of various crops at farms of two villages is given below. Present it through pictogram.
AnswerBy considering the symbol of the respective crop, the pictogram drawn is as under :
Pictogram showing area under cultivation in two villages
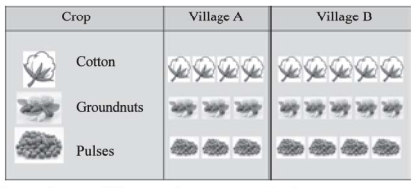
Here, one figure of crop $= 100$ acres of area under cultivation. View full question & answer→Question 32 Marks
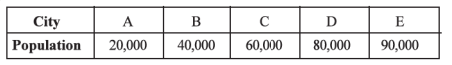
Information regarding the population of five cities is given below. Present it by
a pictogram.
Question 42 Marks
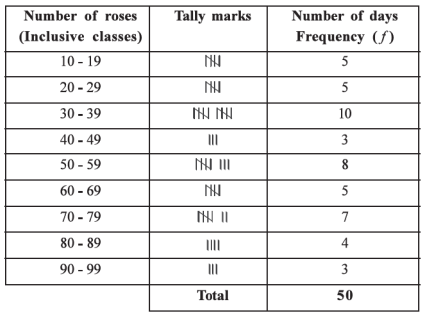
During a season of $50$ days, the data regarding the numbers of roses grown daily on the different plants in a garden are given below. Prepare a frequency distribution from it having one class as $30$ — $39$.
$\text{34 35 37 39 39 54 52 69 71 75 74 76 84 96 23 33 51 39 26 46 65 65 53 53 72 71 84 94 34 24 99 19 18 27 17 38 45 55 57 66 82 85 35 19 18 28 47 52 64 75}$
AnswerThe variable 'number of roses on different rose plants of a garden' is a discrete variable.
$ \text { Range of the given data } R =99-17$
$ =82 $
The range of this discrete variable is large, so it is advisable to prepare inclusive continuous frequency distribution. According to the given inclusive class $30-39$, the class including the lowest value of observation $17$ is $10-19$ and the class including the highest value of observation $99$ is $90-99$.
An inclusive continuous frequency distribution of “number of roses on different rose plants of a garden’
View full question & answer→Question 52 Marks
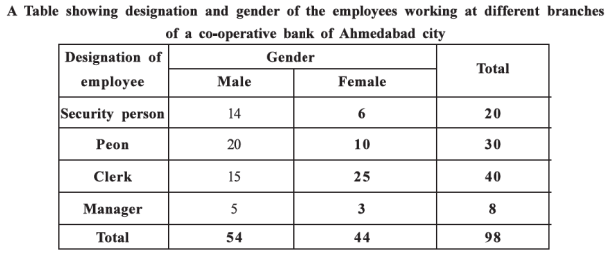
On the basis of the study of different branches of a co—operative bank of Ahmedabad city, the following information is obtained. In this bank, out of $20$ employees working as security persons, $7$ males are married and out of $6$ females, $4$ are married. $12$ peons out of $20$ male peons are married and $10$ female peons are unmarried. Out of $40$ clerks, $25$ are females and of them $12$ are married whereas $7$ male clerks were married and out of $8$ managers, all $3$ female managers are unmarried and all the male managers are married.
AnswerExpress this information in a table.
In the given data, there are three attributes $(i)$ ‘designation of employee” and $(ii)$ “gender of employee’ and $(iii)$ ‘marital status of employee’
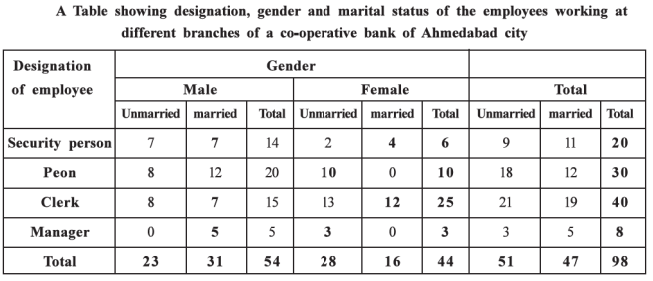
Note : The figures shown in bold letters are the given values in the description of the problem and the remaining values can be obtained by simple calculations. e.g. there are $20$ security persons, of which $6$ are females. Therefore, number of males $= 20 - 6 =14$. Also, out of $6$ security female employees, $4$ are married. Therefore, unmarried female security employees $= 6 - 4 = 2.$ Out of $14$ male security employees, $7$ are married. Hence, the unmarried male security employees $= 14 - 7 = 7$. Total unmarried employees working as security $=7 + 2 = 9$ and total number of married security employees $= 7 + 4 = 11$ and the total of these is $9 + 11 = 20$ which is the total number of security persons in the bank. Similarly, the calculations for the remaining employees can be carried out. View full question & answer→Question 62 Marks
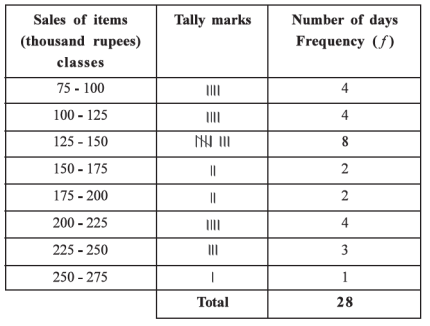
Figures regarding the sales (in thousand rupees) of different items in a super mall during four weeks are as follows:
$\text {228 125 100 90 115 125 230 220 130 80 95 160 180 200 200 128 120 85 185 140 265 230 135 127 100 145 150 210}$
Construct a frequency distribution by classifying these data into $8$ classes.
AnswerThe variable here is 'sales (in thousand rupees)' which is a continuous variable and the number of classes $K=8$ is given.
Range of given data $R=$ Maximum value $-$ Minimum value
$ =265-80$
$ =185 $
$ \therefore \text { Class length } C =\frac{\text { Range }}{\text { Number of class }}=\frac{R}{K}$
$ =\frac{185}{8}$
$ =23.125 $
$\therefore$ For the convenience, class length should be taken as $25$ , i.e. $C=25(C K \geq R)$
By taking the lower limit of the first class as $75$ and the upper limit as $100$ , the minimum value $80$ is included in the first class $75-100$. Similarly the last class $250-275$ includes the maximum value $265$ .
An exclusive continuous frequency distribution of ‘sales (in thousand rupees)’ during for weeks
View full question & answer→Question 72 Marks
On the basis of the study of different branches of a co—operative bank of Ahmedabad city, the following information is obtained. In this bank, out of $20$ employees working as security personnal, $6$ are females, out of $30$ peons, $10$ are females, out of $40$ clerks, $25$ are females and out of $8$ managers, $3$ are females.
AnswerExpress this information in a table. in the given data, there are two attributes $(i)$ ‘designation of employee‘ and $(ii)$ ‘ gender of employee‘.
Note : The figures shown in bold letters are the values given in the description of the illustration and the remaining values can be obtained by simple calculations. View full question & answer→Question 82 Marks
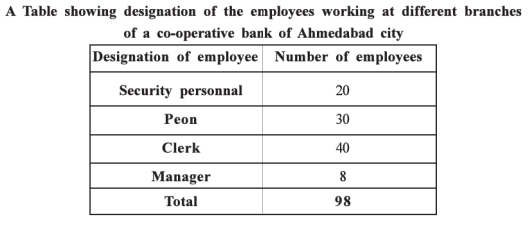
On the basis of a study of different branches of a co-operative bank of Ahmedabad city, the following information is obtained. There are $20$ security personnel, $30$ pcons, $40$ clerks and $8$ managers in the bank. Express this information in a table.
AnswerIn the given data, ‘dcsignation of employee’ is a qualitative characteristic.
View full question & answer→Question 92 Marks
The monthly salaries (in rupees) of $24$ employees working in a private company are given below. Prepare an appropriate frequency distribution from it : $3000, 3500, 4200, 5600, 7500, 9100, 10600, 16200, 18100, 24000, 30000, 36000, 3200, 3300, 5200, 7000, 8400, 9600, 12800, 17700, 22750, 24900, 34000, 40000$
Answer“Salary of employee” is considered as a continuous variable. Range $R = 40000 — 3000 = 37000$ is too large. Hence. we can form a frequency distribution with unequal class lengths. The class lengths of different classes will be decided by studying the given raw data.
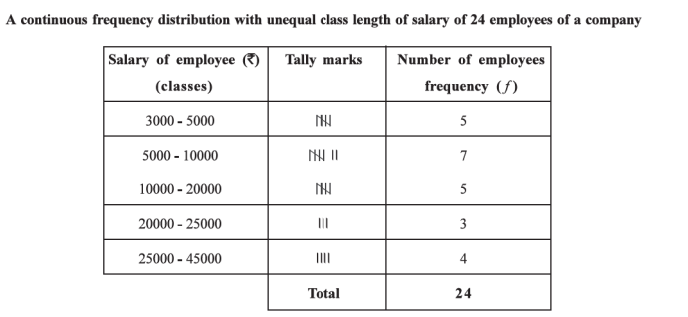
Note : Here it is possible to have frequency distribution other than these classes. View full question & answer→Question 102 Marks
The daily record of sales of electronic equipments sold by a shopkeeper of electronic items during the month of April in as under. Prepare an exclusive continuous frequency distribution for which one of the classes is $60-70$.
Hence, $(i)$ Find the number of days during which the sales of equipment is maximum.$(ii)$ State the number of equipments sold for the maximum number of days.$\text {54 58 52 73 57 39 46 64 49 53 75 34 57 68 51 44 34 40 82 88 80 36 85 66 58 41 62 72 80 81}$
AnswerThe variable “number of electronic equipments sold is a discrete variable but it is clearly given that we have to prepare an exclusive continuous frequency distribution for which one ofthe classes is $60 — 70$. First class = class including of the smallest value $34 = 30 — 40$ Last class = class including the maximum value $88 = 80 — 90$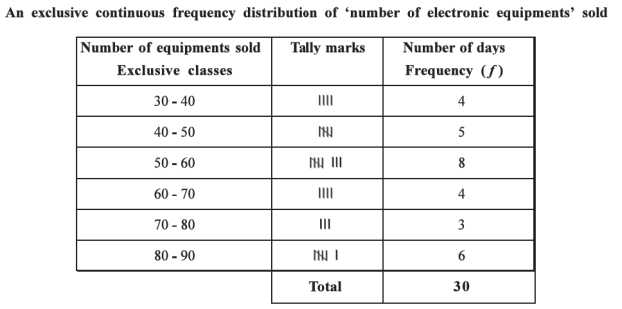
$(i)$ The maximum number of equipments sold is $80$ to $90$ and there are $6$ such days.
$(ii) 50$ to $60$ equipments are sold on maximum $8$ days. View full question & answer→Question 112 Marks
In a television manufacturing company, $500$ television sets are produced during a week. A sample of $50$ television sets is drawn and each television set is examined. The number of defects per set is given below. Prepare an appropriate frequency distribution.
$\text {0 3 2 1 0 5 2 3 0 2 3 0 0 1 0 2 3 4 1 0 4 5 2 1 0 3 2 1 1 0 2 4 2 1 0 0 0 1 0 1 3 1 0 0 0 0 1 1 0 2}$
Answer“Number of defects in a television set’ is a discrete variable and its maximum value is $5$ and minimum value is $0$. Hence, the range of the given data is $R = 5 — 0 = 5$. Therefore, the discrete frequency distribution of number of defects per television set can be obtained as shown below :
A discrete frequency distribution of ‘number of defects per television set’ in a sample of $50$ units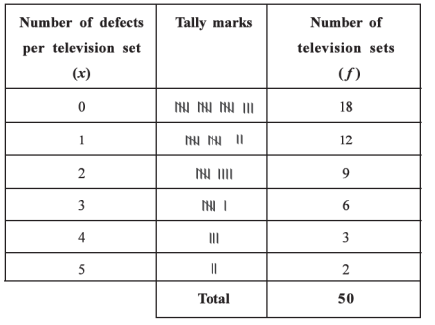
View full question & answer→Question 122 Marks
Prepare ‘less than’ type cumulative frequency distribution from the following :
| Observation |
$10$ |
$20$ |
$30$ |
$40$ |
$50$ |
| Frequency |
$10$ |
$30$ |
$30$ |
$20$ |
$10$ |
Answer
Less than or equal
to observation |
‘Less than’ cumulative frequency cf |
| $10$ |
$10 = 10$ |
| $20$ |
$10 +30 = 40$ |
| $30$ |
$10 + 30 +30 = 70$ |
| $40$ |
$10 +30 +30 +20 = 90$ |
| $50$ |
$10 +30 + 30 +20 +10 = 100$ |
View full question & answer→Question 132 Marks
For the frequency distribution given in the above problem, find the class length of each class.
AnswerThe given frequency distribution is Inclusive continuous frequency distribution. Converting it into exclusive form, we determine class length for each class.The difference between upper limit of a class and the lower limit of immediate following class is $1.$ Therefore we subtract $\frac{1}{2}=0.5$ from the lower limit of a class and add it to the upper limit of the class.
| Exclusive class |
Frequency |
Class length = upper limit – lower limit |
| $-0.5 – 9.5$ |
$10$ |
$9.5- (-0.5) = 10$ |
| $9.5 – 24.5$ |
$20$ |
$24.5 – 9. 5 = 15$ |
| $24.5- 49.5$ |
$30$ |
$49.5 – 24.5 = 25$ |
| $49.5 – 74.5$ |
$20$ |
$74.5 – 49.5 = 25$ |
| $74.5 – 100.5$ |
10$ |
$100.5 -74.5 = 26$ |
View full question & answer→Question 142 Marks
Find the mid values of each class of the following frequency distribution :
| Class |
$0-9$ |
$10-24$ |
$25-49$ |
$50-74$ |
$75-100$ |
| Frequency |
$10$ |
$20$ |
$30$ |
$20$ |
$10$ |
Answer
| Class |
Frequency |
Mid value $=\frac{Upper \ limit + Lower \ limit}{2}$ |
| $0-9$ |
$10$ |
$\frac{9+0}{2}=4.5$ |
| $10-24$ |
$20$ |
$\frac{24+10}{2}=17.0$ |
| $25-49$ |
$30$ |
$\frac{49+25}{2}=37.0$ |
| $50-74$ |
$20$ |
$\frac{74+50}{2}=62.0$ |
| $75 -100$ |
$10$ |
$\frac{100+75}{2}=87.5$ |
View full question & answer→Question 152 Marks
Write formulae for obtaining class boundary points from Inclusive class limits.
AnswerThe formulae to find the class boundary points for the class limits of inclusive continuous frequency distribution are as follows :
Lower boundary point of a class $=\frac{(Lower \ limit \ of \ the \ class) + (Upper \ limit \ of \ the \ class \ preceding \ to \ that \ class)}{2}$
Upper boundary point of a class $=\frac{(Upper \ limit \ of \ the \ class) + (Lower \ limit \ of \ the \ class \ following \ that \ class)}{2}$
View full question & answer→Question 162 Marks
Explain the definition of exclusive continuous frequency distribution.
AnswerIf the upper limit of a class and the lower limit of succeeding class are equal and the upper limit of a class is not included in that class but it is included in its succeeding class, then such classes are called exclusive type classes. A continuous frequency distribution consists of inclusive type classes is called exclusive continuous frequency distribution.
Explanation : The frequency distribution consists of classes $10 - 20, 20 - 30, 30 - 40...$ is exclusive continuous frequency distribution. Here, the upper limit $30$ of class $20-30$ and the lower limit $30$ of its succeeding class $30-40$ are equal. Also upper limit $30$ is excluded from the class $20-30$ and is included in its succeeding class $30 - 40$.
View full question & answer→Question 172 Marks
Explain the definition of inclusive continuous frequency distribution.
AnswerIf the upper limit of a class and lower limit of succeeding class are not equal and the upper limit of a class is included in that class, then such classes are called inclusive type of classes. A continuous frequency distribution consists of inclusive type classes is called inclusive continuous frequency distribution.
Explanation : The frequency distribution consists of classes $10 - 29, 20-29, 30-39...$ is inclusive continuous frequency distribution. Here, the upper limit $29$ of class $20 - 29$ and the lower limit $30$ of its succeeding class $30-39$ are not equal. Also upper limit $29$ is included in the class $20 - 29.$
View full question & answer→Question 182 Marks
Define continuous frequency distribution with illustration.
AnswerA table showing the frequency corresponding to various classes of continuous variable is called continuous frequency distribution. It is prepared, when the range of data is very large.
Continuous frequency distribution showing the height of $50$ students of Std. $XI$
| Height (in cm) |
$90-100$ |
$100-110$ |
$110-120$ |
$120-130$ |
$130-140$ |
Total |
| No. of students $f$ |
$3$ |
$8$ |
$12$ |
$17$ |
$10$ |
$50$ |
View full question & answer→Question 192 Marks
Define discrete frequency distribution with illustration.
AnswerA table showing the frequency corresponding to various values of discrete variable is called discrete frequency distribution. Discrete frequency distribution showing the number of children in 100 families .
| No. of children $x$ |
$0$ |
$1$ |
$2$ |
$3$ |
Total |
| No. of families $f$ |
$5$ |
$30$ |
$45$ |
$20$ |
$100$ |
View full question & answer→Question 202 Marks
Explain two dimensional diagrams in brief.
Answer
- When the volume of data is large, then such data is presented on a diagram considering both length and breadth. Such diagrams are called two dimensional diagrams.
- In two dimensional diagrams total value = Area of diagram
- Square, rectangle. circle, pie or sectorial diagrams are two dimensional diagrams.
View full question & answer→Question 212 Marks
What are one dimensional diagrams ? State their names.
AnswerA diagram drawn by considering only one characteristic of the data is called one dimensional diagram. There are four types of one dimensional diagram :
$(1)$ Bar diagram,
$(2)$ Multiple or adjacent bar diagram,
$(3)$ Simple divided bar diagram and
$(4)$ Percentage divided bar diagram.
View full question & answer→Question 222 Marks
State the limitations of diagram.
AnswerThe limitations of diagrams are as follows:
$(1)$ Lack of accuracy in drawing diagrams leads to wrong interpretation.
$(2)$ Illusionary effect of diagrams misleads the public opinion.
$(3)$There is a loss of accuracy in presenting the data by diagrams.
View full question & answer→Question 232 Marks
Complete the following table :
| Year |
Attribute $A$ |
Attribute $B$ |
Total |
Sub – data
$1$ |
Sub –data
$2$ |
Total |
Sub – data
$1$ |
Sub –data
$2$ |
Total |
Sub – data
$1$ |
Sub –data
$2$ |
Total |
| $2014$ |
$200$ |
|
$300$ |
$100$ |
|
$200$ |
|
|
|
| $2015$ |
|
$400$ |
|
$150$ |
$3000$ |
|
$300$ |
|
|
Answer
| Year |
Attribute $A$ |
Attribute $B$ |
Total |
Sub – data
$1$ |
Sub –data
$2$ |
Total |
Sub – data
$1$ |
Sub –data
$2$ |
Total |
Sub – data
$1$ |
Sub –data
$2$ |
Total |
| $2014$ |
$200$ |
$100$ |
$300$ |
$100$ |
$100$ |
$200$ |
$300$ |
$200$ |
$500$ |
| $2015$ |
$150$ |
$400$ |
$550$ |
$150$ |
$300$ |
$450$ |
$300$ |
$700$ |
$1000$ |
View full question & answer→Question 242 Marks
Demand of a certain item is classified as good, moderate and weak. On the basis of a study for entire year, it is known that the demand was moderate during $22$ weeks, whereas the demand was weak during $18$ weeks. Present this information in a table.
AnswerWe take $52$ weeks a year.
| Demand of an item |
Good |
Medium |
Less |
Total No. of week |
| No. of weeks |
$12$ |
$22$ |
$18$ |
$52$ |
View full question & answer→Question 252 Marks
Define quantitative and qualitative data.
AnswerQuantitative data : The data collected on numeric variable-discrete or continuous are called quantitative data.
Qualitative data: The data collected on the basis of qualitative variable or attribute are called qualitative data.
View full question & answer→Question 262 Marks
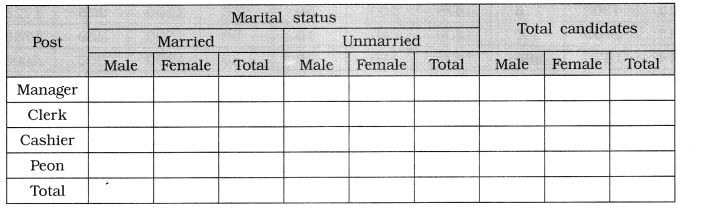
Prepare a blank table by considering the following characteristics for the candidates who appear for the different jobs at a bank:
$(1)$ Designation: Manager, clerk, cashier, peon.
$(2)$ Marital status: Married, unmarried.
$(3)$ Gender: Male, female.
Answer
Table showing the candidates called for the recruitment in a bank according to their post, marital status and gender
View full question & answer→Question 272 Marks
The number of printing mistakes per page of a book of $60$ pages is as follows. Prepare a suitable frequency distribution using the data.
$2, 7, 5, 3, 1, 4, 5, 0, 2, 3, 9, 5, 6, 4, 2, 4, 5, 3, 2, 3, 8, 6, 5, 7, 9, 6, 7, 5, 9,$
$1, 4, 3, 0, 7, 5, 2, 1, 3, 4, 2, 5, 6, 2, 3, 6, 1, 3, 4, 6, 2, 2, 4, 5, 8, 5, 6, 8, 5, 9, 0.$
Answer$3, 4, 9, 8, 7, 11, 7, 4, 3, 4$
View full question & answer→Question 282 Marks
In an essay competition, the number of spelling mistakes made by $50$ students is as follows. Present the data properly in a frequency distribution.
$4, 1, 9, 6, 5, 2, 2, 6, 5, 3, 1, 3, 1, 0, 4, 6, 0, 3, 5, 4, 2, 2, 6, 10, 3, 4,$
$ 7, 6, 3, 9, 5, 4,7, 6, 3, 7, 8, 8, 4, 3, 1, 2, 1, 6, 4, 3, 1, 7, 5, 2.$
Answer$2, 6, 6, 8, 7, 5, 7, 4, 2, 2, 1$
View full question & answer→Question 292 Marks
Inquiring $60$ families residing in a street of Surat city, the number of children per family is obtained as follows. Construct a frequency distribution using this data.
$2, 3, 4, 7, 3, 2, 1, 0, 2, 4, 3, 2, 2, 4, 5, 6, 3, 2, 1, 1, 1, 2, 3, 4, 2, 3, 2, 1, 0,$
$7, 4, 6, 5, 2, 3, 2, 3, 2, 1, 0, 4, 6, 3, 2, 1, 7, 0, 4, 5, 1, 2, 3, 4, 3, 1, 5, 1, 6, 0, 2.$
Answer$5, 10, 15, 11, 8, 4, 4, 3$
View full question & answer→Question 302 Marks
In a garden, the number of flowers on $40$ rose plants was obtained as follows. Prepare a suitable frequency distribution using this data.
$4, 2, 5, 3, 6, 2, 3, 4, 1, 2, 5, 0, 4, 7, 1, 3, 5, 6, 4, 2,$
$3, 4, 2, 3, 3, 5, 4, 1, 2, 4, 3, 6, 5, 4, 3, 5, 3, 2, 4, 3.$
Answerfrequency : $1, 3, 7, 10, 9, 6, 3, 1$
View full question & answer→Question 312 Marks
ExplaIn two dimensional diagrams In brief.
AnswerWhen the volume of data is large, then such data is presented on a diagram consi both length and breadth. Such diagrams are called two dimensional diagrams.
In two dimensional diagrams total value $=$ Area of diagram.
Square, rectangle, circle, pie or sectorial diagrams are two dimensional diagrams.
View full question & answer→Question 322 Marks
What are one dimensional diagrams? State their names.
AnswerA diagram drawn by considering only one characteristic of the data is called one diagram. There are four types of one dimensional diagram:
$(1)$ Bar diagram,
$(2)$ Multiple or adjacent bar diagram,
$(3)$ Simple divided bar diagram and
$(4)$ Percentage divided bar diagram.
View full question & answer→Question 332 Marks
State the limitations of diagram.
AnswerThe limitations of diagrams are as follows:
$(1)$ Lack of accuracy in drawing diagrams leads to wrong interpretation.
$(2)$ Illusionary effect of diagrams misleads the public opinion.
$(3)$ There is a loss of accuracy in presenting the data by diagrams.
View full question & answer→Question 342 Marks
Explain the definition of exclusive continuous frequency distribution.
AnswerIf the upper limit of a class and the lower limit of succeeding class are equal and the upper limit of a class is not Included in that class but it Is included in its succeeding class, then such classes are called exclusive type classes. A continuous frequency distribution consists of enclusive classes is called exclusive continuous frequency distribution.
Explanation: The frequency distribution consists of classes $10—20, 20—30, 30—40 $... is exclusive types classes. A continuous frequency distribution consists of exclusive and the lower limit 30 of its succeeding class $30—40$ are equal. Also upper limit 30 is excluded from the class $20—30$ and is included in its succeeding class $30-40.$
View full question & answer→Question 352 Marks
Explain the definition of inclusive continuous frequency distribution.
AnswerIf the upper limit of a class and lower limit of succeeding class are not equal and the upper limit of a class is included in that class, then such classes are called inclusive type of classes. A continuous frequency distribution consists of inclusive type classes is called inclusive continuous frequency distribution.
Explanation : The frequency distribution consists of classes $10— 19, 20— 29, 30—39$ ... is inclusive continuous frequency distribution. Here, the upper limit $29$ of class $20—29$ and the lower limit 30 of its succeedmg class $30—39$ are not equal. Also upper limit $29$ is included in the class $20—29.$
View full question & answer→Question 362 Marks
Define quantitative and qualitative data.
AnswerQuantitative data : The data collected on numeric variable — discrete or continuous — are called quantitative data.
Qualitative data : The data collected on the basis of qualitative variable or attribute are called qualitative data.
View full question & answer→