Sample QuestionsPresentation of data questions
One sample from each question group in this chapter. Select any group above to see the full set with answer keys.
A continuous distribution has classes $0-9, 10— 19, 20— 29, 30—39$ with the respective frequencies $10, 20, 40, 10$. What is the ‘less than’ type cumulative frequency for the boundary point $29.5 ?$
Answer: A.
View full solution →A discrete variable has values $0, 1, 2, 3, 4$ with the respective frequency $2, 4, 6, 8, 14$. What is the value of ‘more than’ type cumulative frequency when the value of variable is $2 ?$
Answer: D.
View full solution →Inclusive classes for a distribution are $10— 19.5, 20—29.5, 30—39.5$. What are the exclusive class limits for the second class ?
- A
$19—29$
- B
$20—30$
- C
$19.75—29.75$
- ✓
$19.5—29.5$
Answer: D.
View full solution →Range of an ungrouped data is $55$ and It is divided into $6$ classes. Then, what Is the class length ?
Answer: D.
View full solution →In continuous frequency distribution, what is the class length of a class ?
- A
Average of upper boundary point and lower boundary point of the class.
- ✓
Difference between upper boundary point and lower boundary point of that class.
- C
- D
Average of two successive lower boundary points.
Answer: B.
View full solution →Define ‘less than’ type cumulative frequency distribution for discrete data.
Define cumulative frequency.
When should one form a frequency distribution with unequal class lengths ?
State the method to determine number of classes on the basis of range of data and class length.
Define the frequency of an observation.
The following frequency distribution of unequal class length is obtained for some
data. Prepare a frequency distribution stating class length and mid value of each class.
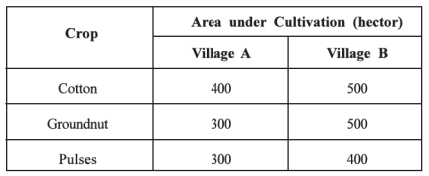
The data regarding area under cultivation of various crops at farms of two villages is given below. Present it through pictogram.
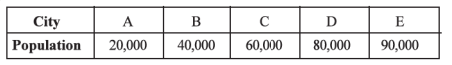
Information regarding the population of five cities is given below. Present it by
a pictogram.
During a season of $50$ days, the data regarding the numbers of roses grown daily on the different plants in a garden are given below. Prepare a frequency distribution from it having one class as $30$ — $39$.
$\text{34 35 37 39 39 54 52 69 71 75 74 76 84 96 23 33 51 39 26 46 65 65 53 53 72 71 84 94 34 24 99 19 18 27 17 38 45 55 57 66 82 85 35 19 18 28 47 52 64 75}$
View full solution →On the basis of the study of different branches of a co—operative bank of Ahmedabad city, the following information is obtained. In this bank, out of $20$ employees working as security persons, $7$ males are married and out of $6$ females, $4$ are married. $12$ peons out of $20$ male peons are married and $10$ female peons are unmarried. Out of $40$ clerks, $25$ are females and of them $12$ are married whereas $7$ male clerks were married and out of $8$ managers, all $3$ female managers are unmarried and all the male managers are married.
View full solution →‘Less than’ type cumulative frequency distribution of weight (in kg.) of 50 persons
is given in the following table.
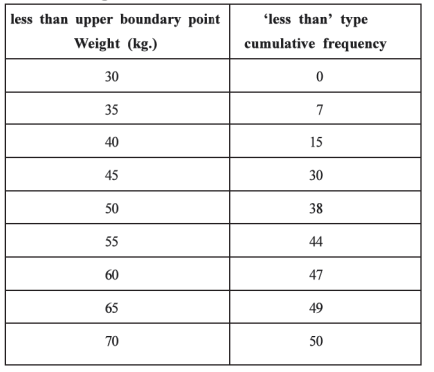
(i) How many persons have weight less than 45 kg. ?
(ii) How many persons have weight between 50 kg. and 65 kg. ?
(iii) Obtain the original frequency distribution.
A frequency distribution of number of children in 50 families of a region is as
under :

Obtain ‘less than’ type and ‘more than’ type cumulative frequency distributions for
these data.
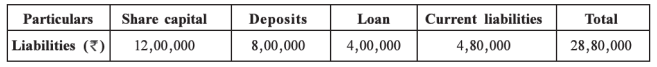
In a ledger of a company, the liabilities in the final balance sheet are as under. Present the data by a pie diagram.
80 members participated in a picnic organized by a school and the average contribution was Rs. 300 as expenditure. There were 60 students and each of them contributed Rs. 325. Teachers contributed little more for the picnic. There was a support staff of 10 males and contribution was not collected from them. 20% of those participated in picnic were females and 2 of them were teachers. Represent the data in a table.
Information regarding the number of errors per page in a book of 500 pages is
as under. Find the inclusive frequency distribution from it.
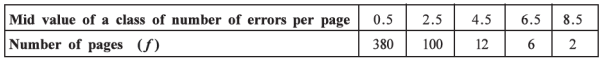
By considering the inclusive frequency distribution obtained in illustration $3$, find
$(i)$ Exclusive frequency distribution and
$(ii)$ Frequency distribution showing mid value of each class.
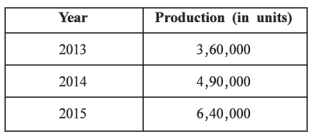
View full solution →The data on the production of an industrial unit during three years is as under.
Present it by using circle diagram.
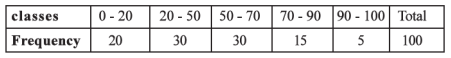
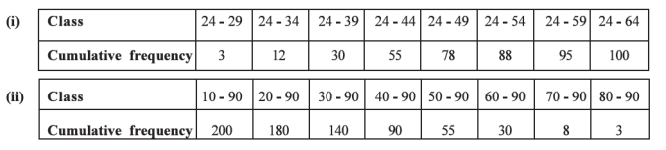
Obtain the original frequency distribution from the following frequency distribution:
Changes in prices of shares during a (lay of $40$ different companies registered at Bombay stock exchange are as follows. Find an inclusive continuous frequency distribution having mid value $—]$ for one of the classes and regular class length as $5$.
$\text{-8 8 7 16 8 22 6 10 -7 5}$
$\text{3 -4 9 -11 11 16 9 -3 -11 2}$
$\text{5 -6 10 -6 13 -5 3 -7 12 0}$
$\text{7 6 12 -5 21 0 4 -10 14 -2}$
View full solution →Present the following data in an appropriate tabular form. A bank receives $2000$ applications as a response to the job advertisement. Of the total applicants, $50\%$ were graduates, $40\%$ were post graduates and remaining $10\%$ have professional degree. Among the graduates, $60\%$ were males and of them, $25\%$ were married. $40\%$ female graduates were married. Among the post graduates, $60\%$ were males and $40\%$ of them were married. Among post graduate
females, $50\%$ were married. $30\%$ of the females had professional degree and of them, $60\%$ were married. The number of married and unmarried males having professional degree was equal.
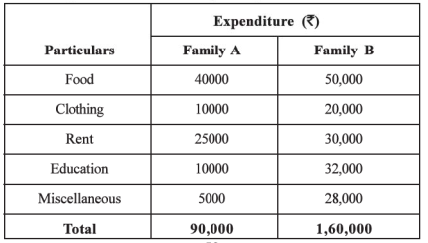
View full solution →Information regarding the annual expense on different particulars of two middle class families is given below. Draw a pic diagram for the data.
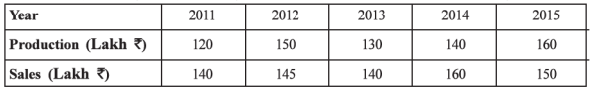
The information regarding the production (in lakh ?) and sales (in lakh $T$) for a factory during five years is given below. Present it in a suitable diagram.
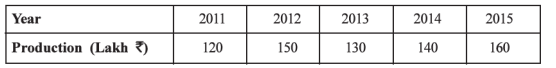
View full solution →The information regarding the production (in lakh ?) in a factory during five years is given below. Present it in a suitable diagram.
In a university, out of total $50,000$ students, $35\%$ are in commerce faculty, $30\%$ are in arts faculty, $20\%$ are in science faculty, $10\%$ are in engineering faculty and remain- ing $5$"/u are in medical faculty. The ratio of number of boys and girls in commerce faculty is $4:3$. ln arts faculty, the number of girls is double than that of boys. In science and engineering faculty, there are $60\%$ and $70\%$ boys respectively and in medical faculty, boys and girls are in equal numbers.
View full solution →Out of $300$ persons residing in a region, a sample of $30$ persons is selected at random and the heights (in $cm$.) of these selected persons are as under :
$\text{163 148 151 162 145 152 149 158 153 149 150 152 145 141 162 168 148 158 149 141 146 155 159 150 161 153 162 160 154 165}$
$(i)$ Distribute these data into $6$ classes and also find the mid value of each class.
$(ii)$ Obtain ‘less than’ type cumulative frequency distribution.
$(iii)$ What is the percentage of persons having height less than $155 \ cm.$?
$(iv)$ Obtain ‘more than’ type cumulative frequency distribution.
$(v)$ How many persons have the height between $147$ to $157 \ cm.$?
View full solution →