The velocity $(v)-$ time $(t)$ plot of the motion of a body is shown below:
(image)
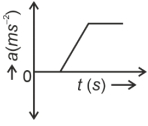
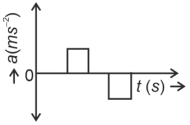
The acceleration $(a)-$ time $(t)$ graph that best suits this motion is :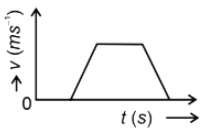
- A
- ✓
- C
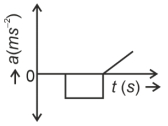
- D
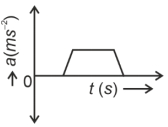
Answer: B.
View full solution →