MCQ
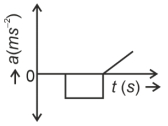
The velocity $(v)-$ time $(t)$ plot of the motion of a body is shown below:
(image)
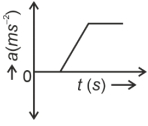
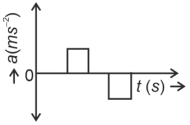
The acceleration $(a)-$ time $(t)$ graph that best suits this motion is :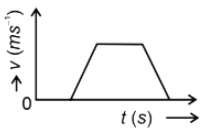
- A
- ✓
- C
- D
(image)
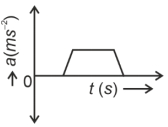
The acceleration $(a)-$ time $(t)$ graph that best suits this motion is :
After some time, velocity becomes constant and acceleration is zero.
After that, the slope of v-t curve is constant and negative.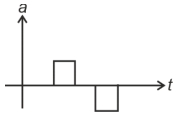
Generate a complete, print-ready paper with questions like this in minutes — across 16+ boards, with answer keys.
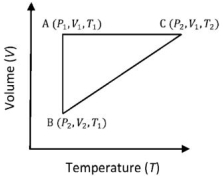
The correct option ($s$) is (are)
$(A)$ $q_{A C}=\Delta U_{B C}$ and $W_{A B}=P_2\left(V_2-V_1\right)$ $(B)$ $W _{ BC }= P _2\left( V _2- V _1\right)$ and $q _{ BC }= H _{ AC }$ $(C)$ $\Delta H _{ CA }<\Delta U _{ CA }$ and $q _{ AC }=\Delta U _{ BC }$ $(D)$ $q_{B C}=\Delta H_{A C}$ and $\Delta H_{C A}>\Delta U_{C A}$