The following graph represents the $T-V$ curves of an ideal gas (where $T$ is the temperature and $V$ the volume) at three pressures $P_1, P_2$ and $P_3$ compared with those of Charles's law represented as dotted lines.
Then the correct relation is: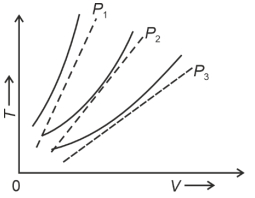
- A$P_1>P_3>P_2$
- B$P_2>P_1>P_3$
- ✓$P_1>P_2>P_3$
- D$P_3>P_2>P_1$
Answer: C.
View full solution →