Question 13 Marks
To study the relation between two variables, yearly income $(X)$ of a family and their yearly investment $(Y)$ in mutual funds, the following information is shown for a sample of $100$ families of a city.$X =$ Annual income of a family $($lakh $₹) y =$ Annual investment in mutual fund of a family $($thousand $₹)\bar{x}=5.5, \bar{y}=40.5, s_{x}=1.2, s_{y}=12.8, r=0.65$ Obtain the regression line of annual investment in mutual fund of a family on their annual income. Estimate the annual investment in mutual fund of a family whose annual income is $₹ 4.5$ lakh.
View full question & answer→Question 23 Marks
If $\bar{x}=60, \bar{y}=75$ and $s_{x}^{2}: \operatorname{Cov}(x, y)=5: 3$, obtain the regression line of $Y$ on $X$ and estimate $y$ for $X=65$ from it.
View full question & answer→Question 33 Marks
If $\bar{x}=5, \bar{y}=11$ and $b=1.2$, obtain the regression line of $Y$ on $X$.
View full question & answer→Question 43 Marks
The following information is obtained for monthly advertisement cost and the sales of the last year for a company providing online shopping:
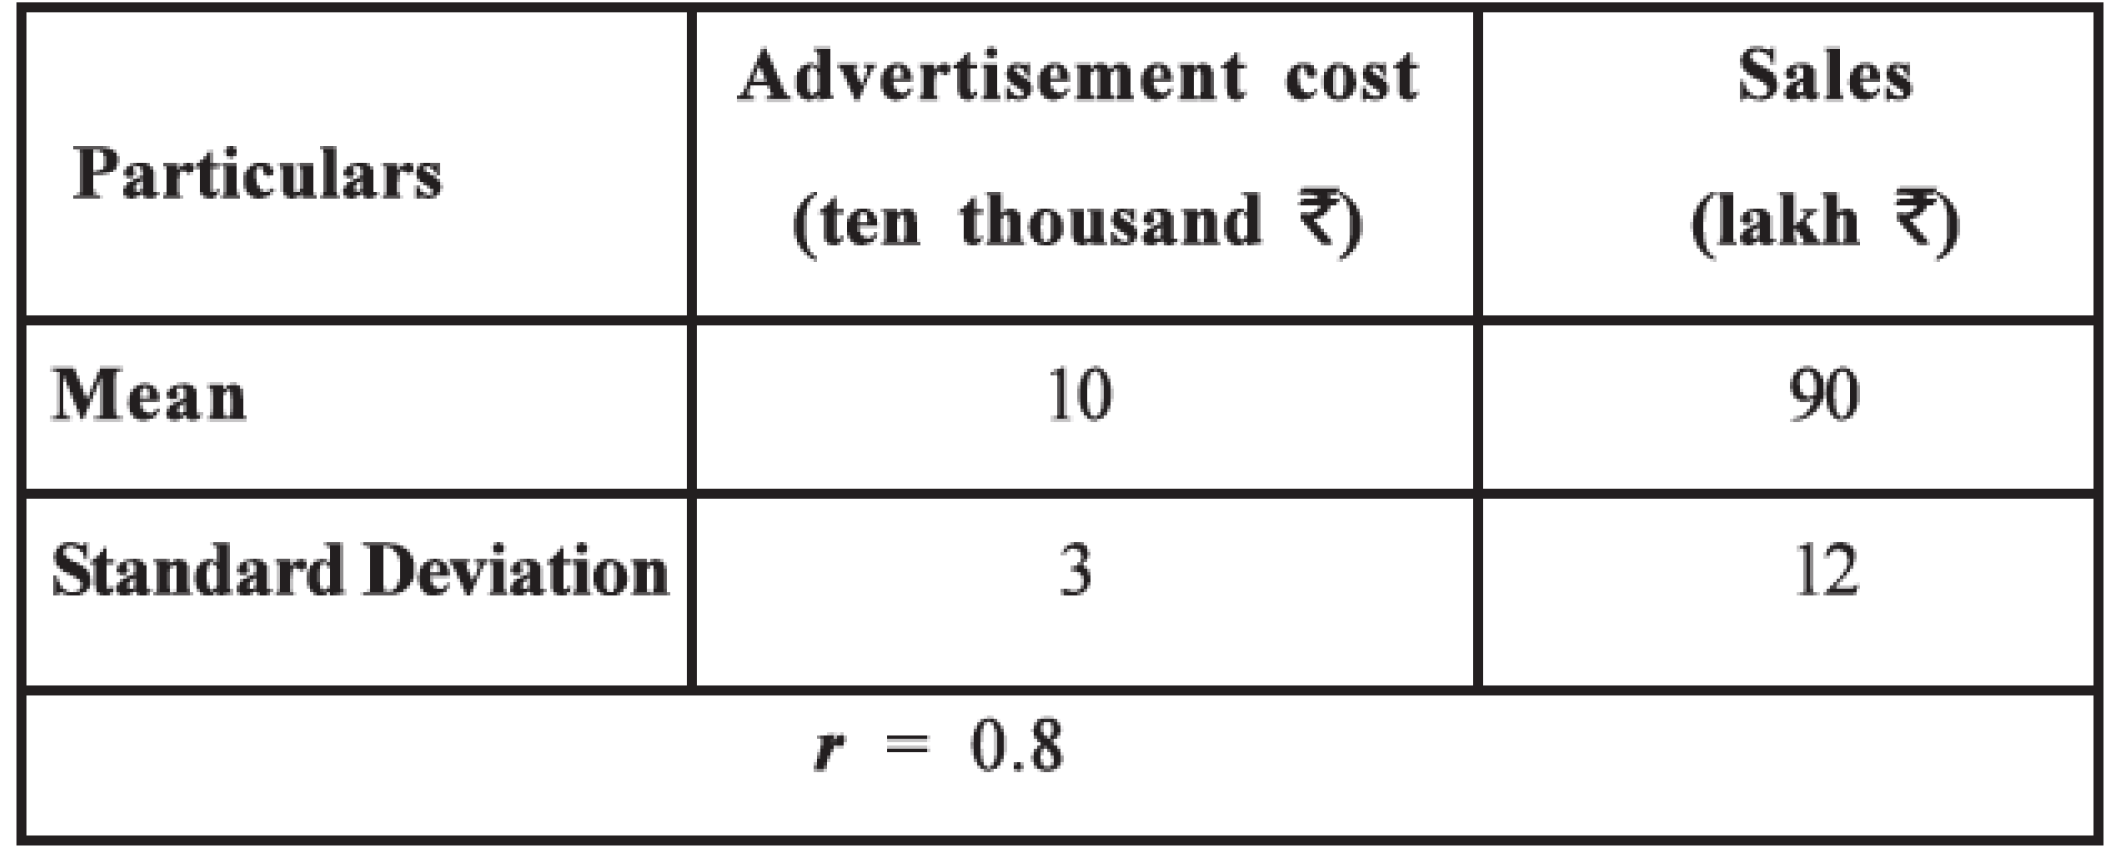
Obtain the regression line of the sales on the advertisement cost.
AnswerHere, $X =$ Advertisement cost and $Y =$ Sales
$\therefore x̄ = 10; ȳ = 90; S_x = 3; S_y = 12; r = 0.8$
Now, $b = r . \frac{\mathrm{S}_{y}}{\mathrm{~S}_{x}}$
$\therefore b = 0.8 \times \frac{12}{3}$
$= 3.2$
$a = ȳ – bx̄$
$a = 90 – 3.2 (10)$
$= 90 – 32$
$= 58$
The regression line of the sales $(Y)$ on the advertisement cost $(X):$
Putting $a = 58$ and $b = 3.2$, in $ŷ = a + bx,$ we get $ŷ = 58 + 3.2x.$
View full question & answer→Question 53 Marks
If $\bar{x}=30, \bar{y}=50, r =0.8$ and the standard deviations of $X$ and $Y$ are $2$ and $5$ respectively obtain the regression line of $Y$ on $X.$
AnswerHere,$=30,=50, r=0.8, S_x=2 \text { and } S_y=5 b=r \cdot=0.8 \times=b=2 \text { Now, } a=-b=50-2(30)$
$=50-60$
$=-10$
$\therefore a=-10$ Regression of line Y on $X : \therefore= a + bx \therefore=-10+2 x$ Thus, Regression life of $Y$ on $X$ is $=-10+2 x$
View full question & answer→Question 63 Marks
For two related variables $X$ and $Y, \sum (x – x̄)^2 = 80, \sum (x – \bar X ) (y – ȳ) = 60, x̄ = 8, ȳ = 10.$ Obtain the regression line of $Y$ on $X.$
AnswerHere, $\Sigma(x-\bar{x})^2=80 ; \Sigma(x-\bar{x})(y-\bar{y})=60$;
$
\bar{x}=8 ; \bar{y}=10
$
Now, $b=\frac{\Sigma(x-\bar{x})(y-\bar{y})}{\Sigma(x-\bar{x})^2}$
$
\begin{aligned}
& \therefore b=\frac{60}{80} \\
& =0.75
\end{aligned}
$
$
\begin{aligned} \\
& a=\bar{y}-b \bar{x} \\
& \therefore a=10-0.75(8) \\
& =10-6 \\
& =4
\end{aligned}
$
The regression line of $Y$ on $X$ is $\hat{y}=a+b x$.
Putting $\mathrm{a}=4$ and $\mathrm{b}=0.75$ in $\hat{y}=\mathrm{a}+\mathrm{bx}$ the regression line of $\mathrm{Y}$ on $X$ obtained is $\hat{y}=4+0.75 \mathrm{x}$.
View full question & answer→Question 73 Marks
State precautions which are necessary while using the regression.
AnswerWhile using application of regression line, following precautions are taken into consideration.
- Necessary information can be obtained by regression line in different section like economics, business, industry, training, psychology, medical, planning.
- Study of regression does not prove cause and effect relationship between two variables but only assumption is made that two variable are correlated.
- Trustworthiness of co-efficient of regression can be measured. So, usage of regression should be careful.
View full question & answer→Question 83 Marks
Explain : Co-efficient of determination.
AnswerIt is the square of the correlation co-efficient between the observed value of dependent variable $Y$ and its estimated values.
- The measure of the closeness of the correlation between variable $Y$ and $X$ is given by co-efficient of determination.
- It is denoted by $R^2.$
- The least value of $R^2 = 0$ and maximum value is $1.$
- Regression line can be obtained for one variable with a given value of another variable but validity of that value depends on correlation of this two variables.
- If their is perfect correlation $(r=1)$ between two variables, then we can say that assumption of linear regression is proper but correlation between two variables, then we can say that assumption of linear regression is Proper but correlation between two variables is nearer to $‘0’,$ then we can say that assumptions are not proper.
- So, trustworthiness of regression line depends on value of correlation.
- So, this value is known as co-efficient of determination, which is denoted by $R^2.$
- Maximum value of $R$ is $1.$
- Minimum value of $R^2$ is $0,$ which denotes lack or correlation between two variables.
- If co-efficient of determination $R^2 = 1$ or nearer to $1,$ then it can be said that assumption of linear correlation between $Y$ and $X$ is valid.
- If the co-efficient of determination $R^2= 0$ or nearer to $0,$ it can be said that assumption of linear correlation between $Y\ \&\ X$ is not valid.
- But it can not be said that there is no relation between $Y$ and $X.$
- Co-efficient of determination is a square of correlation coefficient. 80, one can say that $R^2 = r^2$
- So, value of $R^2$ is $0 \leq R^2 \leq 1.$
- Here, $R^2 = ($Co-efficient Correlation $ Y,)^2 = \{r(Y,X)\}^2$
$= \{r(Y,)\}^2 = r^2$
$= \{r(Y,a+bx)\}^2 \therefore R^2 = r^2$
- Uses :
- $(1)$ To know the trustworthiness of assumptions, estimates obtained by using the line of regression.
- $(2)$ To check the validity of the assumption of linear correlation between variable $Y\ \&\ X.$
View full question & answer→Question 93 Marks
State the utility of regression.
AnswerUses of Regression line are as follows :
- It helps to estimate the value of one variable for a given value of other variable.
- It helps us in estimating the change in the value of one variable for a unit increases in the value of other variable.
- To know if error arise in finding the value of regression.
- It helps us in marketing, planning, commercial field and management, for taking decision of finding assumptions.
View full question & answer→Question 103 Marks
Explain the method of least square for fitting a regression line.
Answer
The best fitted regression line of $Y$ on $X$ can be obtained by this method. Suppose n ordered pairs of sample observations on two correlated variables $X$ and $Y$ are $(x_1, y_1), (x_2, y_2), …, (x_n, y_n).$ To understand the least square method we draw the scatter diagram for this data.
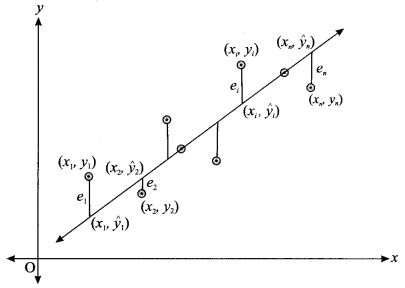
If the equation of best fitted line showing the linear regression between $Y$ and $X$ is $ŷ = a + bx$ then the values of constants a and b can be obtained by least square method as follows:
Suppose $ŷ_1, ŷ_2, ………, ŷ_n$ are the estimated values for the values $y_1, y_2, ………. y_n$ of $Y$ obtained by the equation of line $Y$ corresponding to the values $x_1, x_2, ………., x_n$ of variable $X.$
Now, for a given value $x_1$ of $x,$ the corresponding to the value y of $y_1$ the estimated value $ŷ$ of $y$ will be $ŷ = a + bx_1.$
The values of constants a and b of the fitted line $ŷ = a + bx$ are obtained by least square method in such a way so that the sum of squares of errors $\sum e_i^2$ becomes minimum, where $(e = y – ŷ)$. Thus, $\sum e^2 = \sum (y – ŷ)^2 = \sum (y – a – bx)^2$ becomes minimum.
The line $ŷ = a + bx$ obtained passes through close to most of the points on scatter diagram. While obtaining the regression line, the sum of squares of errors is minimised, therefore it is called method of least square. View full question & answer→Question 113 Marks
Explain the methods of scatter diagram for fitting a line of regression and state its limitation.
AnswerSuppose n pairs of observations of two correlated variables $X$ and $Y$ are $(x_1, y_1); (x_2, y_2)…..(x_n, y_n)$ Using this data we draw a scatter diagram.
- Now a line is drawn in such a way that it is close to almost all the points of the scatter diagram.
- If $Y$ is a dependent variable and $X$ is an independent variable then such a line is called regression line of $Y$ on $X$ and an approximate value of dependent variable $Y$ can be obtained for any given value of independent variable $X$ from it.
- Merits :
- It is very easy and quick method of fitting a regression line.
- No computation is required to draw such a line.
- Demerits :
- A line of regression drawn by this method is not the best fitted line because it does not guarantee the best estimate of the dependent variable.
- Different persons may draw different lines.
- As a result different persons may provide different estimates of the dependent variable $Y.$
View full question & answer→Question 123 Marks
The following results are obtained for a bivariate data.
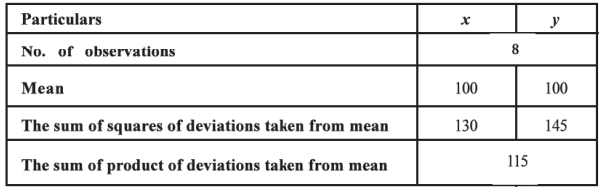
Obtain the regression line of $Y$ on $X.$ AnswerHere, $\mathrm{n}=8 ; \bar{x}=100 ; \bar{y}=100$;
$\Sigma(x-\bar{x})^2=130 ; \Sigma(y-\bar{y})^2=145$ and
$\Sigma(x-\bar{x})(y-\bar{y})=115$ are given.
Now, $\mathrm{b}=\frac{\Sigma(x-\bar{x})(y-\bar{y})}{\Sigma(x-\bar{x})^2}$
$\therefore b=\frac{115}{130}$
$ =0.88$
$ a=\bar{y}-b \bar{x}$
$ \therefore a=100-0.88(100)$
$ =100-88$
$ =12$
Regression line of $Y$ on $X$ is $\hat{y}=a+b x$
Putting $a=12$ and $b=0.88$ in $\hat{y}=a+b x$, the regression line of $Y$ on $X$ obtained is $\hat{y}=12+0.88 x$.
View full question & answer→Question 133 Marks
If $b_{y x}=0.8$ then find the value of $b_{v u}=$ for the following $u$ and $v$. $(i)\ u=x-105$ and $v=y-90$ $(ii)\ u=\frac{x-1400}{100}$ and $v= \frac{y-750}{50}$ $(iii)\ u=10(x-4.6)$ and $v=y-75$
Answer$(i)\ u=x-105 \text { and } v=y-90$
$u=x-105=x-A$
$\text { and } v=y-90=y-B$
$\therefore b_{v u}=b_{y x}=0.8$
$( \because b$ is independent of change of origin$).$
$(ii)\ u=\frac{x-1400}{100}$ and $v=\frac{y-750}{50}$
$u=\frac{x-1400}{100}=\frac{x-A}{C_x} \therefore C_x=100$
and $v=\frac{y-750}{50}=\frac{y-B}{C_y} \therefore C_y=50$
Now, $b_{y x}=b_{v u} \cdot \frac{C_{ y }}{C_x}$
$\therefore b_{v u}=b_{y x} \cdot \frac{C_x}{C_y}$
$=0.8 \times \frac{100}{50}=1.6$
$(iii)\ u=10(x-4.6) \text { and } v=y-75$
$u=10(x-4.6)=\frac{x-4.6}{\frac{1}{10}}=\frac{x-A}{C_x}$
$\therefore C_x=\frac{1}{10} \text { and } v=y-75=\frac{y-B}{C_y} \quad \therefore C_y=1$
Now, $b_{y x}=b_{v u} \cdot \frac{C_y}{C_x}$
$\therefore b_{v u}=b_{y x} \cdot \frac{C_z}{C_y}$
$=0.8 \times \frac{\frac{1}{10}}{1}$
$=0.8 \times \frac{1}{10}$
$=0.08$
View full question & answer→Question 143 Marks
In usual notations, $n = 7; \sum u = 2; \sum v = 25; \sum u^2 = 160$ and $\sum uv = 409.$ Obtain the regression coefficient of a regression line of $Y$ on $X$ and interpret it.
Answer$\mathrm{n}=7, \Sigma \mathrm{u}=2, \Sigma \mathrm{v}=25, \Sigma \mathrm{u}^2=160 \text { and } \Sigma \mathrm{uv}=409$
$ \text { Now, } b=\frac{n \Sigma u v-(\Sigma u)(\Sigma v)}{n \Sigma u^2-(\Sigma u)^2}$
$ =\frac{7(409)-(2)(25)}{7(160)-(2)^2}$
$ =\frac{2863-50}{1120-4}$
$ =\frac{2813}{1116}$
$ =2.52$
Interpretation: $b=2.52$.
Hence it can be said that a unit Increase in the value of the variable $X$ implies an estimated Increase of $2.52$ units in the value of variable $Y.$
View full question & answer→Question 153 Marks
If the regression line of $Y$ on $X$ is $\hat{y}=11+3 x$ and $S_x: S_y=3: 10$, find the co-efficient of determination.
Answer$\hat{y}=11+3 x \therefore b=3$
$S_x: S_y=3: 10$
$\therefore S_x=3, S_y=10$
Now, $b=r \cdot \frac{ S _y}{S_x}$
$\therefore 3=r \times \frac{10}{3}$
$\therefore r=3 \times \frac{3}{10}=\frac{9}{10}=0.9$
Now, coefficient of determination
$R^2=(r)^2$
$\therefore R^2=(0.9)^2$
$=0.81$
View full question & answer→Question 163 Marks
Explain the statement “There is a cause and effect relationship between two variables” by giving a suitable example. Also define independent variable and dependent variable.
AnswerOut of two random variables, if value of one variable changes, then how it affects on another variable is known as “cause & effect” relationship between two variables.
- E.g. Rain & Production Here, rain is independent variable $X$ and production is dependent variable $Y.$
- We can assume through this relation that what is the reaction on production due to $↑$ or $↓$, in rain.
- $(1)$ Independent Variable :
- If there is cause and effect relationship between two variables, a change in the value of one variable will result in a corresponding change in the value of another variable.
- The variable in which changes are made by us is a casual variable and is called independent variable which is denoted as $‘X’.$ e.g. Rain & Production. Here rain is independent variable.
- $(2)$ Dependent Variable :
- In cause & effect relationship, effect is called a dependent variable is denoted as $Y.$ e.g. Rain & Production.
- Due to change of one unit in rain whatever changes occur in production is called dependent variable.
View full question & answer→Question 173 Marks
The information regarding maximum temperature $(X)$ and sale of ice cream $(Y)$ of six different days in summer for a city is given below:
Maximum temperature $=x ($in celsius$),$
Sale of ice cream $=r ($in lakh $) \bar{x}=40, \bar{y}=1.2, \sum x y=306, s_{x}{ }^{2}=20$ obtain the regression line of sale of ice cream on maximum temperature. Estimate the sale of ice cream if the maximum temperature on a day is $42$ celsius.
Answer$\bar{y}=-4.8+0.15 x$ and for maximum daily temperature $x=42$ celcius, estimate of sale of icecream $\hat{y}=1.5 ($lakh$)$
View full question & answer→Question 183 Marks
The following information is given for ten firms running business of clothes in a city regarding their average annual profit $($in lakh $₹)$ and average annual administrative cost $($in lakh $₹) :$
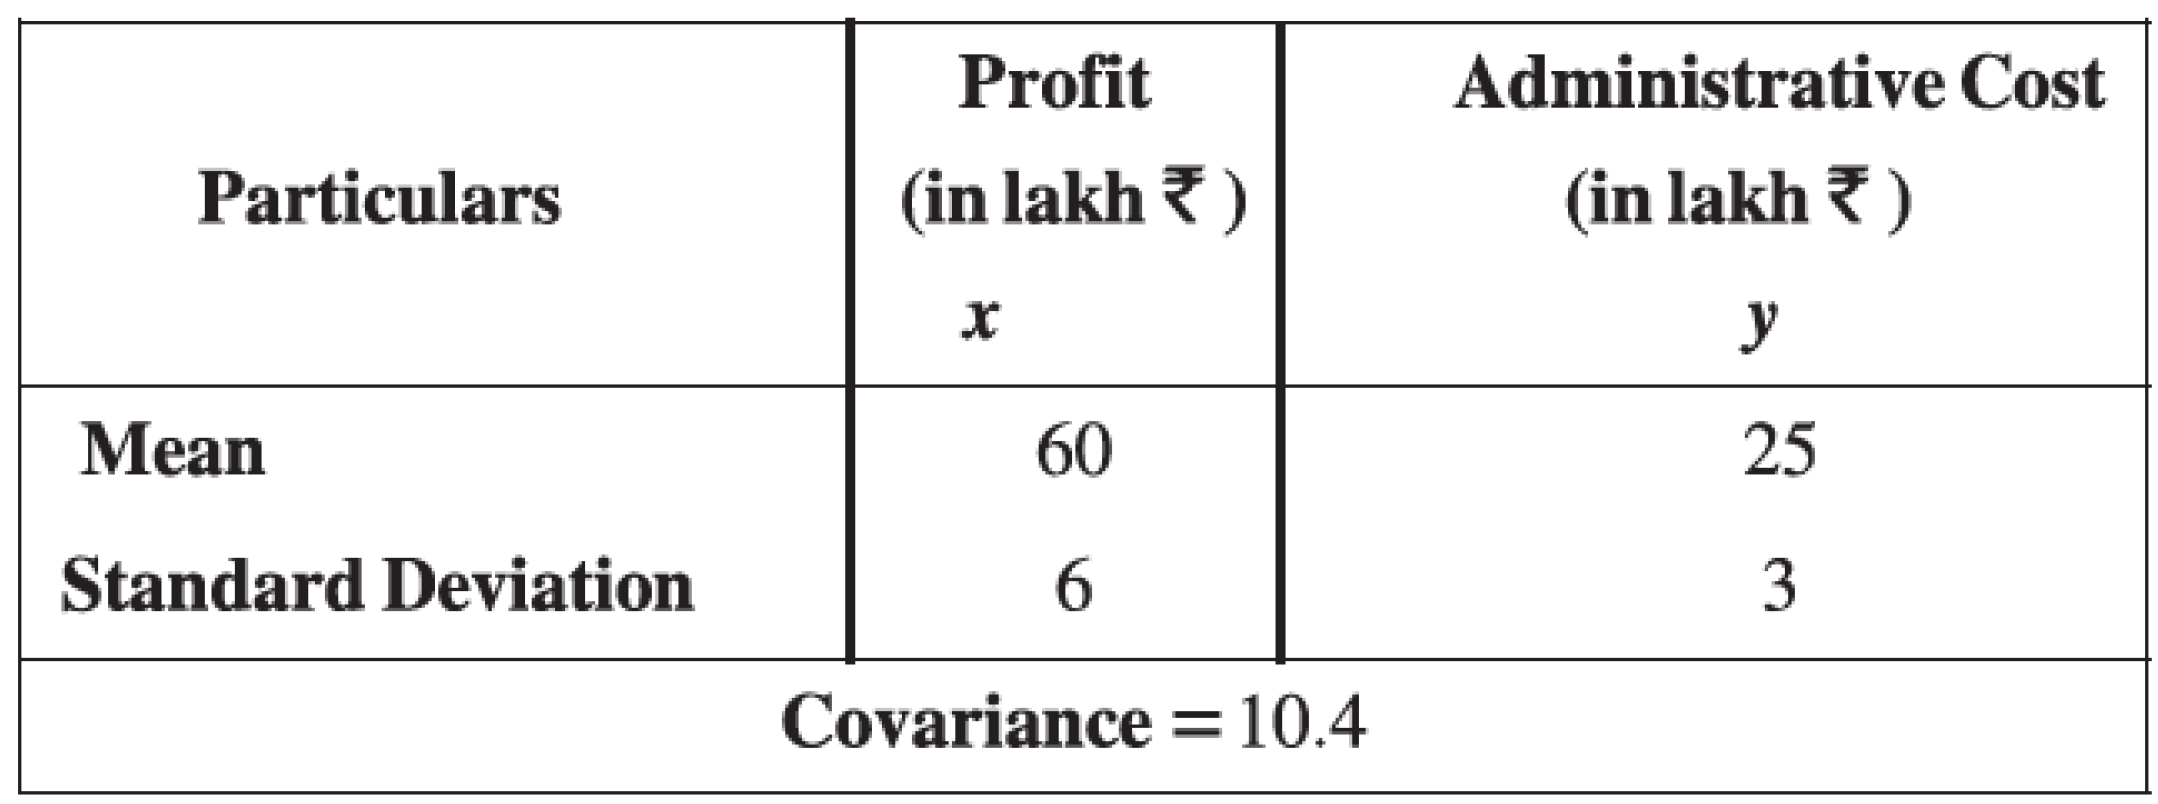
AnswerHere, $x̄ = 60; ȳ = 25; S_x = 6; S_y = 3$ and Cov $(x, y) = 10.4$
Regression line of $Y$ on $X$:
$ŷ = a + bx$
$b = \frac{{Cov}(x, y)}{{S}_{x}^{2}}$
$=\frac{10.4}{(6)^{2}}$
$= \frac{10.4}{36}$
$= 0.29$
$a = ȳ – bx̄$
$= 25 – 0.29(60)$
$= 25 – 17.4$
$= 7.6$
Putting $a = 7.6$ and $b = 0.29 $ in $ŷ = a + bx,$ we get $ ŷ = 7.6 + 0.29 x$
View full question & answer→Question 193 Marks
Obtain the regression line of $Y$ on $X$ from the following data: $\bar{x}=82, \bar{y}=180, S_{z}^{2}=64, S_{y}^{2}=225 ; r_{x y}=0.82$ Estimate $Y$ for $X =60$.
Answer$\overline{\hat{y}}=53.72+1.54 x, x=60$$\hat{y}=146.12$
View full question & answer→Question 203 Marks
If $\bar{x}=15, \bar{y}=25$ and $b=1.8$, estimate $Y$ for $X=15$.
Answer$a=-2, \hat{y}=-2+1.8 x, \hat{y}=25$
View full question & answer→Question 213 Marks
If $x=80, y=120 ; S_{x}^{2}: \operatorname{Cov}(x, y)=8: 5$, obtain the regression line of $Y$ on $X$ and estimate $Y$ for $X=40$.
Answer$\hat{y}=70+0.625 x, \hat{y}=95, x=40$
View full question & answer→Question 223 Marks
The regression line of $Y$ on $X$ is $\hat{y}=60+4.5 X$ and one of the observation used In fitting of the line is $(15,125)$. Find the error estimating $Y$ for $X=15$.
View full question & answer→Question 233 Marks
If the regression line of $Y$ on $X$ is $\hat{y}=35+4 x$, Coy $(x, y)=100$ and standard deviation of $Y$ is 25 , find the standard deviation of $X$ and coefficient of determination.
Answer$S_{x}-5, R^{2}-0.64$
View full question & answer→Question 243 Marks
If the regression line of $Y$ on $X$ is $8 x+5 y-80=0$, find the regression coefficient (b).
View full question & answer→Question 253 Marks
If the regression line of $Y$ on $X$ is $\hat{y}=\frac{x}{3}+15 ; S_{y}: S_{x}=5: 3$ find the coefficient of determination.
View full question & answer→Question 263 Marks
If $u =8( x -30), v =5( y -20)$ and $b_{y z}=2.4$. find the value of $b_{m}$
View full question & answer→Question 273 Marks
If $u=\frac{x-8}{5}, v=\frac{y-10}{3}, b_{y x}=0.12$, find the value of $b_{c u}$
Answer$\overline{b_{y u}}=0.2$
View full question & answer→Question 283 Marks
For a bivariate data, $b_{y z}=1.17 ; S_{x}^{2}: S_{y}^{2}=9: 81$ find $R^{2}$.
View full question & answer→Question 293 Marks
$n=20, \Sigma(x-8)=40, \Sigma(y-10)=50, \Sigma x^{2}=2050, \Sigma y^{2}=3145 ; \Sigma x y=$ 2475 Calculate the regression coefficient of $Y$ on $X$ and constant a.
Answer$\bar{x}=10, \bar{y}=12.5 ; b=-0.5 ; a=17.5$
View full question & answer→Question 303 Marks
Following data is collected on two mutually dependent variables $X$ and $Y$ : $n=25, \Sigma x=125, \Sigma y=100, \Sigma x y=508, \Sigma x^{2}=650, \Sigma y^{2}=440$ obtain the regression line of $Y$ on $X$. Estimate $Y$ for $X=15$.
Answer$\hat{y}=2.4+0.32 x ; \hat{y}=7.2$
View full question & answer→Question 313 Marks
Following data is collected from 10 sample observations of mutually dependent variables $X$ and $Y$ :
$\Sigma(x-12)=-4, \Sigma(y-32)=-10 . \Sigma(x-12)^{2}=16, \Sigma(y-32)^{2}=$
$40, \Sigma(x-12)(y-32)=22$
From this data', find the intercept of the regression line.
View full question & answer→Question 323 Marks
Variables $X$ and $Y$ are mutually dependent variables. Following information is collected using the substitutions $u=x-55$ and $v=y-120$ : sample size $=9, \Sigma u=$ $-8, \Sigma v=6, \Sigma u^{2}=40, \Sigma v^{2}=24 ; \Sigma u v=-30$, obtain the regression line of $Y$ on $x$.
Answer$\overline{\hat{y}=161.25-0.75 x}$
View full question & answer→Question 333 Marks
Two variables $X$ and $Y$ are mutually dependent variables, $\Sigma(x-\bar{x})(y-\bar{y})=$ $-200, n S_{x}^{2}=125 ; n S_{y}^{2}=500$, find $b_{y n}$
View full question & answer→Question 343 Marks
$X$ and $Y$ are two mutually dependent variables.
$
\sum_{1}^{20}(x-32)=0, \sum_{1}^{20}(y-48)=0, \Sigma(x-32)^{2}=120, \Sigma(y-48)^{2}=
$
$260 ; \Sigma(x-32)(y-48)=-78$ obtain the regression line of $Y$ on $X$.
Answer$\overline{\hat{y}}=68.8-0.65 x$
View full question & answer→Question 353 Marks
Random variables $X$ and $Y$ are mutually dependent variables. Following results are obtained from $10$ observations of these variables: $\Sigma x=780 ; \Sigma y=1300 ; \Sigma(x-78)^{2}=1256 ; \Sigma(y-130)^{2}=3140, \Sigma(x-$ $78)(y-130)=-1884 .$ from this data find the intercept of the regression line of $Y$ on $x$.
View full question & answer→Question 363 Marks
Following data is collected from $12$ observations of two mutually dependent variables $X$ and $Y$ : $\Sigma(x-40)=0 ; \Sigma(y-52)=0 ; \Sigma(x-40)^{2}=175 ; \Sigma(y-52)^{2}=$
View full question & answer→Question 373 Marks
The regression line of $Y$ on $X$ is $\hat{y}=28+0.8 x$ and $\operatorname{Coy}(x, y)=20$. Find the variance of variable $X$
View full question & answer→Question 383 Marks
For two mutually dependent variables $X$ and $Y , 25 S_{z}=8 S_{y}=10 Cov (x, y)=40$ , find $B_{y z}$ and $r^{2}$.
Answer$b=1.5625 ; R^{2}=0.25$
View full question & answer→Question 393 Marks
Random variables $X$ and $Y$ are mutually dependent variables. Following data is collected from a random sample of $10$ observations: $\Sigma x=360: \Sigma y=450 ; \operatorname{Cov}(x, y)=90 ; S_{x}=9, S_{y}=12$
Answer$\hat{y}=84.96-1.11 x$
View full question & answer→Question 403 Marks
Following data is collected on dependent variable ( $Y$ ) and independent variable ( $X$ ):
$n=20 ; \operatorname{Cov}(x, y)-120 ; S_{x}=10 ; S_{y}=20 ; \bar{x}=105, \bar{y}=90$
View full question & answer→Question 413 Marks
If the regression line of Y on X is $\hat{y}=11+3x$ and $S_{x}:S_{y}=3:10$, find the coefficient of determination.
AnswerFrom line, $b = 3$.
$b = r \cdot \frac{S_y}{S_x} \implies 3 = r \cdot \frac{10}{3} \implies r = \frac{9}{10} = 0.9$.
Coefficient of determination $R^2 = r^2 = (0.9)^2 = 0.81$.
View full question & answer→Question 423 Marks
The information of price (in ₹) of a ball pen and the supply of ball pen (in units) at the end of each month of a year for a company making ball pen is given below. Estimate the supply of ball pen when its price is ₹ 40 :
| Detail |
Price (x) |
Supply (y) |
| Average |
30 |
500 |
| Variance |
25 |
10000 |
|
Co - variance = 400 |
|
Answer1. $b = \frac{Cov(x,y)}{S_x^2} = \frac{400}{25} = 16$.
2. $a = \bar{y} - b\bar{x} = 500 - 16(30) = 500 - 480 = 20$.
3. Regression line : $\hat{y} = 20 + 16x$.
4. For $x = 40$: $\hat{y} = 20 + 16(40) = 20 + 640 = 660$ units.
View full question & answer→Question 433 Marks
The following measures are obtained to study the relation between rainfall in cm $( X )$ and yield of Bajri in quintal per hectare $( Y )$ in ten different regions during monsoon $n=10, \bar{x}=40, \bar{y}=175, S _{x}=12, \operatorname{Cov}(x, y)=360$. Obtain the regression line of yield $Y$ on rainfall $X$.
Answer$b = \frac{Cov(x,y)}{S_{x}^{2}} = \frac{360}{144} = 2.5$.
$a = \overline{y} - b\overline{x} = 175 - 2.5(40) = 175 - 100 = 75$.
Regression line : $\hat{y} = 75 + 2.5x$.
View full question & answer→Question 443 Marks
The information of price (in ₹) of a ball pen and the supply of ball pen (in units) at the end of each month of a year for a company making ball pen is given below. Estimate the supply of ball pen when its price is ₹ 40 :
| Detail | Price (x) | Supply (y) |
| Average | 30 | 500 |
| Variance | 25 | 10000 |
| r = 0.8 | |
Answer$S_{x}=5, S_{y}=100$.
$b = r \cdot \frac{S_{y}}{S_{x}} = 0.8 \cdot \frac{100}{5} = 16$.
$a = \overline{y} - b\overline{x} = 500 - 16(30) = 500 - 480 = 20$.
Regression line: $\hat{y} = 20 + 16x$.
When $x=40, \hat{y} = 20 + 16(40) = 20 + 640 = 660$.
The estimated supply is 660 units.
View full question & answer→Question 453 Marks
The following information is obtained for monthly advertisement cost and the sales of the last year for a company providing online shopping :
| Particulars | Advertisement Cost (Ten thousand ₹) | Sales (Lakh ₹) |
| Mean | 10 | 90 |
| Standard Deviation | 3 | 12 |
| r = 0.8 | |
Obtain the regression line of the sales on advertisement cost.
AnswerThe mean advertisement cost is $\bar{x}=10$ (ten thousand $7$ ) and the mean sales is $\bar{y}=90$ (lakh $7$ ).
The standard deviation of advertisement cost is $\sigma_x=3$ and the standard deviation of sales is $\sigma_y=12$.
The coefficient of correlation is $r=0.8$.
The regression coefficient of sales on advertisement cost is
$b_{y x}=r \times \frac{\sigma_y}{\sigma_x}=0.8 \times \frac{12}{3}=3.2 .$
The regression equation of sales on advertisement cost is
$y-\bar{y}=b_{y x}(x-\bar{x})$.
Substituting the values,
$y-90=3.2(x-10)$
Simplifying,
$\begin{array}{l}
y-90=3.2 x-32 \\
y=3.2 x+58
\end{array}$
Therefore, the regression line of sales on advertisement cost is
$y=3.2 x+58$.
View full question & answer→Question 463 Marks
State properties of regression co-efficient. Also state the point through which a regression line always passes.
Answer1. $ r $ and $ b_{yx} $ always have the same sign.
2. It is independent of change of origin but not scale.
3. $ b_{yx} = r \cdot \frac{S_{y}}{S_{x}} $.
The regression line always passes through the point $ (\overline{x}, \overline{y}) $.
View full question & answer→Question 473 Marks
State the properties of regression coefficient. Also state the point through which a regression line always passes.
AnswerProperties: 1. It has the same sign as correlation coefficient (r).
2. It is independent of change of origin but not scale.
Point : Regression line always passes through ($\bar{x}, \bar{y}$).
View full question & answer→Question 483 Marks
Answer$b = r \cdot \frac{S_y}{S_x} = 0.82 \cdot \frac{15}{8} = 1.5375$
$a = \bar{y} - b\bar{x} = 180 - 1.5375(82) = 180 - 126.075 = 53.925$
Line : $\hat{y} = 53.93 + 1.54x$
For $x=60$ : $\hat{y} = 53.93 + 1.54(60) = 53.93 + 92.4 = 146.33$ quintals.
View full question & answer→