A shopkeeper bought $25$ flower pots, $18$ flower vases, $23$ lampshades and $16$ sculptures. Help him to represent the data using tally marks.
View full solution →Question types
CH - 14. Data Handling question types
8 questions across 3 question groups — pick any mix to generate a MATHS paper with step-by-step answer keys.
8
Questions
3
Question groups
5
Question types
01
Answer the following (2 mark each) :
1 Q→02Answer the following (4 mark each) :
5 Q→03Do as Directed.
2 Q→Sample Questions
CH - 14. Data Handling questions
One sample from each question group in this chapter. Select any group above to see the full set with answer keys.
Shahin is overweight as compared to the other children of her age. The graph below shows her weight from the age of $5$ years to the present age ( $10$ years). Study the graph and answer the questions that follow.
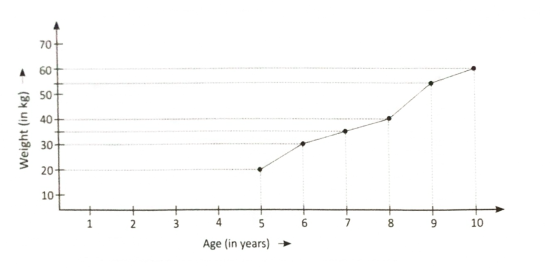
$a.$ What was her weight when she was $7$ years old?
$b.$ How much weight has she gained from $5$ years to $8$ years?
$c.$ What is the increase in her weight from $8$ years to $9$ years?
View full solution →$a.$ What was her weight when she was $7$ years old?
$b.$ How much weight has she gained from $5$ years to $8$ years?
$c.$ What is the increase in her weight from $8$ years to $9$ years?
The given tally chart shows the number of children who attend activity classes in the evening after school.
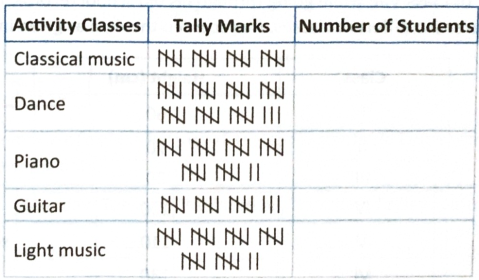
Answer the following questions based on the given data.
$a$. Complete the last column of the table.
$b$. Find the total number of children who attend classes after school.
$c$. Find the total number of children who attend dance class and light music class.
$d$. Which two classes are equally attended by the children?
$e$. How many more children attend classical music than guitar?
View full solution →Answer the following questions based on the given data.
$a$. Complete the last column of the table.
$b$. Find the total number of children who attend classes after school.
$c$. Find the total number of children who attend dance class and light music class.
$d$. Which two classes are equally attended by the children?
$e$. How many more children attend classical music than guitar?
The pie chart given below represents the number of tourists from four countries, who visited India in the year $2023.$ Answer the following questions by looking at the pie chart.
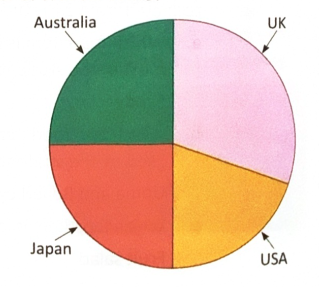
$a.$ From which country did the highest number of tourists come?
$b.$ From which two countries did the same number of tourists come?
$c.$ Tourists from which country are more - $\text{UK}$ or Japan?
$d.$ From which country did the least number of tourists come?
View full solution →$a.$ From which country did the highest number of tourists come?
$b.$ From which two countries did the same number of tourists come?
$c.$ Tourists from which country are more - $\text{UK}$ or Japan?
$d.$ From which country did the least number of tourists come?
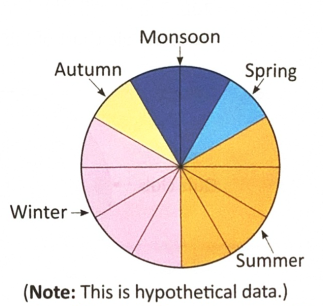
The pie chart given below represents the different seasons of India. The pie chart is divided into $12$ equal parts. Each part shows $1$ month. Fill in the following table with the help of the pie chart.
View full solution →
| Season | Number of months |
| Winter | |
| Monsoon | |
| Spring | |
| Autumn | |
| Summer |
Given below is the data collected for the favourite ice-cream flavours of $36$ students in a class. Draw a pie chart to represent the data.
View full solution →| Favourite flavour | Vanilla | Pista | Butterscotch | Strawberry | Mango | Chocolate |
| Number of students | $9$ | $9$ | $6$ | $6$ | $3$ | $3$ |
Given below is the price per kg of onions from January to June of a particular year.
Draw a line graph for the above data. From the graph, find the price of onions in
i. mid-May
ii. mid-March
View full solution →| Jan | Feb | Mar | April | May | June |
| $₹48$ | $₹52$ | $₹70$ | $₹60$ | $₹62$ | $₹58$ |
i. mid-May
ii. mid-March
The temperature of a place for a week is given in the table below. Draw a line graph to represent the data.
View full solution →| Day | Monday | Tuesday | Wednesday | Thursday | Friday | Saturday | Sunday |
| Temperature in ${ }^{\circ} C$ | $23$ | $25$ | $22$ | $25$ | $27$ | $24$ | $26$ |
Generate a CH - 14. Data Handling paper free
Pick question groups from the list above, set marks and difficulty, and export a branded PDF with step-by-step answer keys. First 3 chapters free — no signup.