Questions

Answer the following (4 mark each) :

🎯

Test yourself on this topic

5 questions · timed · auto-graded

Question 14 Marks
Shahin is overweight as compared to the other children of her age. The graph below shows her weight from the age of $5$ years to the present age ( $10$ years). Study the graph and answer the questions that follow.
Image
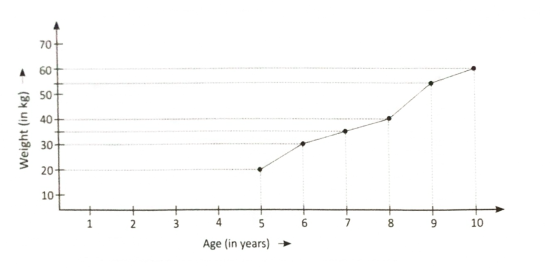
$a.$ What was her weight when she was $7$ years old?
$b.$ How much weight has she gained from $5$ years to $8$ years?
$c.$ What is the increase in her weight from $8$ years to $9$ years?
Answer
$a. 35 \ kg$
$b. 20 \ kg$
$C. 15 \ kg$
View full question & answer
Question 24 Marks
The given tally chart shows the number of children who attend activity classes in the evening after school.
Image
Answer the following questions based on the given data.
$a$. Complete the last column of the table.
$b$. Find the total number of children who attend classes after school.
$c$. Find the total number of children who attend dance class and light music class.
$d$. Which two classes are equally attended by the children?
$e$. How many more children attend classical music than guitar?
Answer
$a. 20 ; 38 ; 32 ; 18 ; 32$
$b. 140$
$c. 70$
$d.$ Piano and light music
$e.2$
View full question & answer
Question 34 Marks
The pie chart given below represents the number of tourists from four countries, who visited India in the year $2023.$ Answer the following questions by looking at the pie chart.
Image


$a.$ From which country did the highest number of tourists come?
$b.$ From which two countries did the same number of tourists come?
$c.$ Tourists from which country are more - $\text{UK}$ or Japan?
$d.$ From which country did the least number of tourists come?
Answer
$a. \text{UK}$
$b. $ Australia and Japan
$c. \text{UK}$
$d. \text{USA}$
View full question & answer
Question 44 Marks
The pie chart given below represents the different seasons of India. The pie chart is divided into $12$ equal parts. Each part shows $1$ month. Fill in the following table with the help of the pie chart.
Image
Season Number of months
Winter  
Monsoon  
Spring  
Autumn  
Summer  
Answer
Winter: $4$ months;
Monsoon: $2$ months;
Spring: $1$ month;
Autumn: $1$ month;
Summer: $4$ months
View full question & answer
Question 54 Marks
Given below is the data collected for the favourite ice-cream flavours of $36$ students in a class. Draw a pie chart to represent the data.
Favourite flavour Vanilla Pista Butterscotch Strawberry Mango Chocolate
Number of students $9$ $9$ $6$ $6$ $3$ $3$
Answer
SELF
View full question & answer
Answer the following (4 mark each) : - MATHS STD 5 Questions - Vidyadip