According to data of question 5, which fruit is liked by most Of the Students?
- AO
- BG
- CM
- DA
42 questions across 9 question groups — pick any mix to generate a MATHS paper with step-by-step answer keys.
M.C.Q. [1 Marks Each]
11 Q→02Assertion (A) & Reason (B) MCQ
3 Q→03TRUE-FLASE [1 Marks Each]
6 Q→04BLANKS [1 Marks Each]
6 Q→051 Marks Question
5 Q→062 Marks Questions
2 Q→073 Marks Question
6 Q→085 Marks Questions
2 Q→09Match the following.
1 Q→One sample from each question group in this chapter. Select any group above to see the full set with answer keys.
| Shops | Number of tins of paint sold |
| A | 100 |
| B | 120 |
| C | 160 |
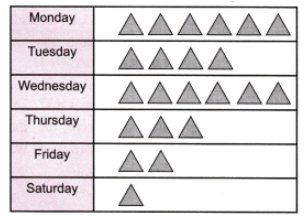
| Day | Number of absentees |
| Monday | 10 |
| Tuesday | 20 |
| Wednesday | 25 |
| Thursday | 15 |
| Friday | 30 |
| Saturday | 20 |
Pick question groups from the list above, set marks and difficulty, and export a branded PDF with step-by-step answer keys. First 3 chapters free — no signup.

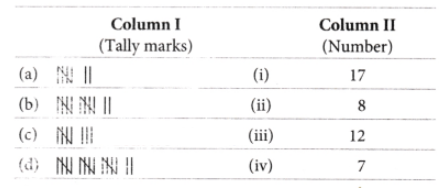
 represents _______________