Question 15 Marks
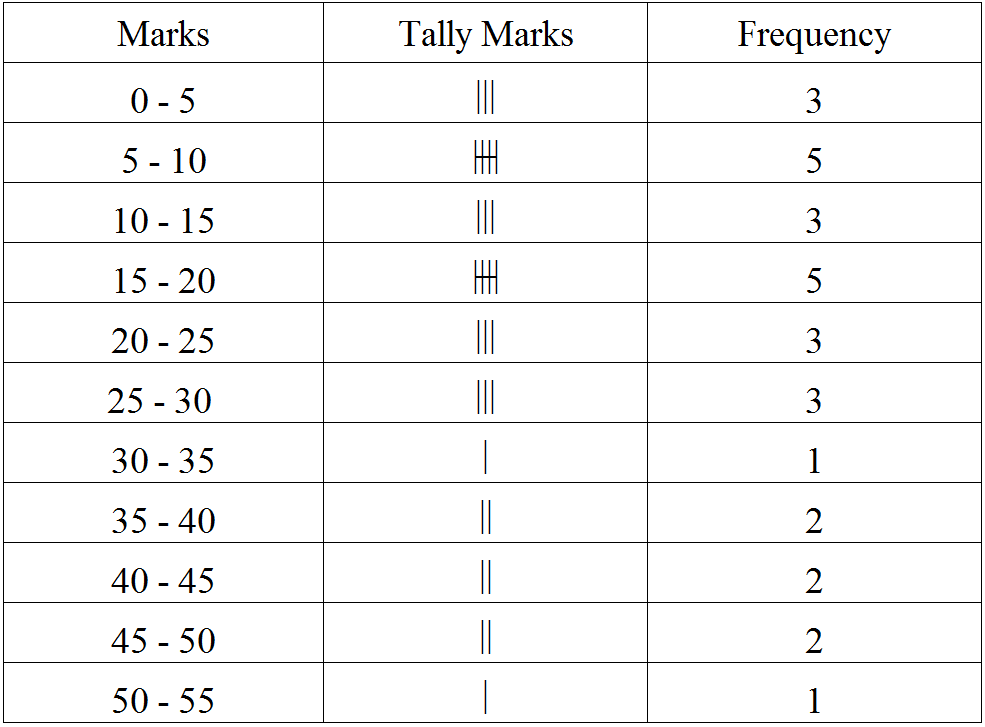
Construct a frequency table with class-intervals $0-5$ ($5$ not included) of the following marks obtained by a group of $30$ students in an examination. $0, 5, 7, 10, 12, 15, 20, 22, 25, 27, 8, 11, 17, 3, 6, 9, 17, 19, 21, 29, 31, 35, 37, 40, 42,45, 49, 4, 50, 16$.
AnswerThe frequency table with class intervals $0-5, 5-10, 10-15,$ ____, $50-55$ is given below:
View full question & answer→Question 25 Marks
The marks scored by $40$ students of class VIII in mathematics are given below: $81, 55, 68, 79, 85, 43, 29, 68, 54, 73, 47, 35, 72, 64, 95, 44, 50, 77, 64, 35, 79, 52, 45, 54, 70, 83, 62, 64, 72, 92, 84, 76, 63, 43, 54, 38, 73, 68, 52, 54$. Prepare a frequency distribution with class size of $10$ marks.
AnswerThe frequency table of the marks scored by $40$ students of class VIII in mathematics is given below: 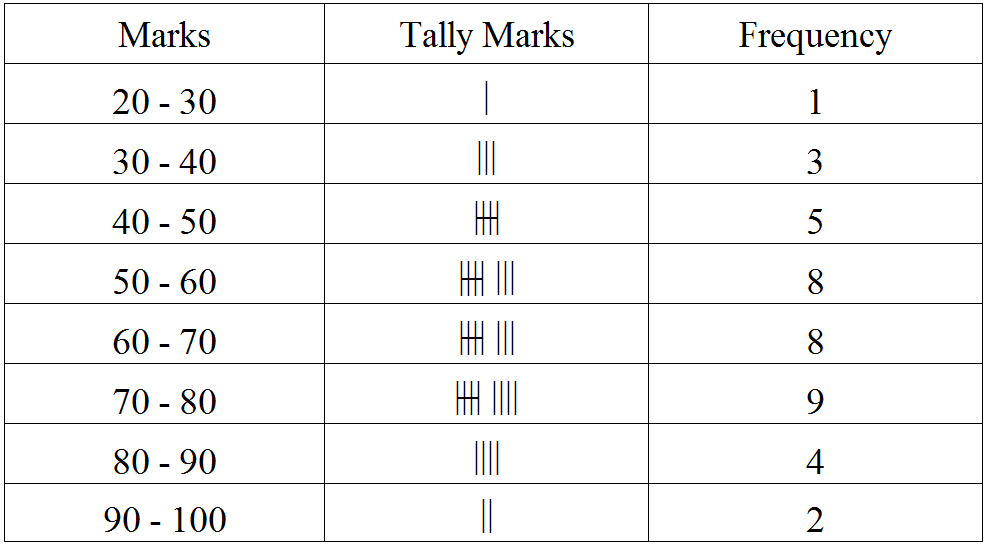
View full question & answer→Question 35 Marks
Construct a frequency table with equal class intervals from the following data on the monthly wages (in rupees) of $28$ labourers working in a factory, taking one of the class intervals as $210-230 (230$ not included$): 220, 268, 258, 242, 210, 268, 272, 242, 311, 290, 300, 320, 319, 304, 302, 318, 306, 292, 254, 278, 210, 240, 280, 316, 306, 215, 256, 236.$
AnswerThe frequency table of the monthly wages of $28$ labourers working in a factory is given below: 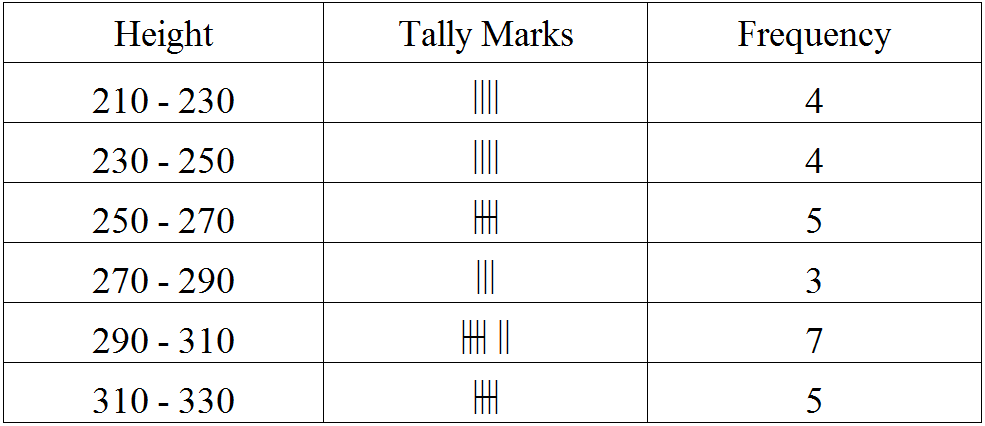
View full question & answer→Question 45 Marks
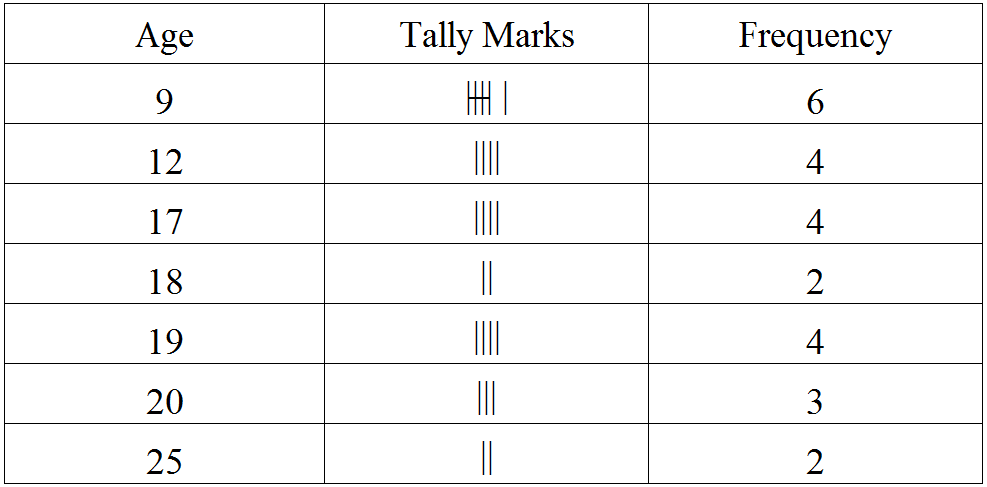
Construct a frequency distribution table for the following marks obtained by $25$ students in a history test in class $\text{VIII}$ of a school: $9, 17, 12, 20, 9, 18, 25, 17, 19, 9, 12, 9, 12, 18, 17, 19, 20, 25, 9, 12, 17, 19, 19, 20, 9.$
$i.$ What is the range of marks?
$ii.$ What is the highest mark?
$iii.$ Which mark is occurring more frequently?
AnswerThe frequency distribution table is given below:
View full question & answer→Question 55 Marks
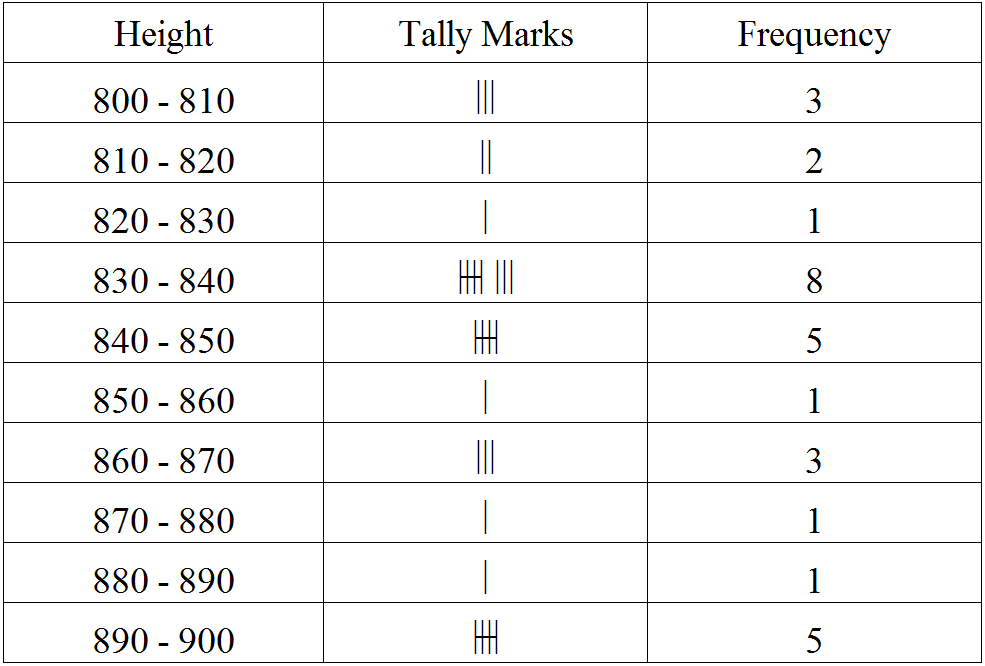
The monthly wages of $30$ workers in a factory are given below:
$830, 835, 890, 810, 835, 836, 869, 845, 898, 890, 820, 860, 832, 833, 855, 845, 804, 808, 812, 840, 885, 835, 836, 878, 840, 868, 890, 806, 840, 890.$
Represent the data in the form of a frequency distribution with class size $10$.
AnswerThe frequency table of the monthly wages of $30$ workers in a factory is given below:
View full question & answer→Question 65 Marks
Following figures relate to the weekly wages $($in $Rs)$ of $15$ workers in a factory: $300, 250, 200, 250, 200, 150, 350, 200, 250, 200, 150, 300, 150, 200, 250.$
Prepare a frequency table:
$i.$ What is the range in wages $($in $Rs)$?
$ii.$ How many workers are getting $Rs\ 350$?
$iii.$ How many workers are getting the minimum wages?
AnswerThe frequency table for the number of accidents per day for a period of $30$ days is given below:
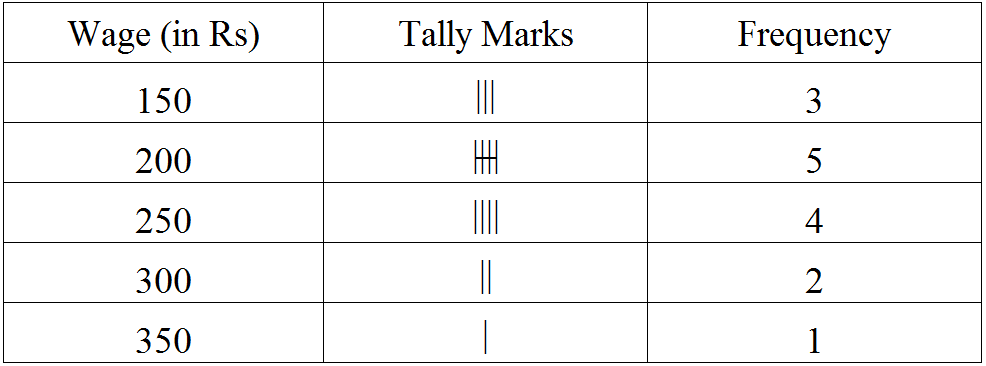
$i.$ The range of wages $($in $Rs)$ is $350-150$ i.e. $200$.
$ii.$ From the frequency table, we can see that the number of workers earning $Rs.350$ is $1$.
$iii.$ Here, the minimum wage is $150$. Hence, the number of workers earning the minimum wage is $3$. View full question & answer→Question 75 Marks
The final marks in mathematics of $30$ students are as follows:
$53, 61, 48, 60, 78, 68, 55, 100, 67, 90, 75, 88, 77, 37, 84, 58, 60, 48, 62, 56, 44, 58, 52, 64, 98, 59, 70, 39, 50, 60.$
Now answer the following:
$i.$ Arrange these marks in the ascending order, $30$ to $39$ one group, $40$ to $49$ second group etc.
$ii.$ What is the highest score?
$iii.$ What is the lowest score?
$iv.$ What is the range?
$v.$ If $40$ is the pass mark how many have failed?
$vi.$ How many have scored $75$ or more?
$vii.$ Which observations between $50$ and $60$ have not actually appeared?
$viii.$ How many have scored less than $50$?
AnswerThe given raw data can be arranged in an ascending order. The class intervals are $30-39, 40-49, ..........$ $100-109$.
Then, take the raw data and place it in the appropriate class intervals.
$i.$The marks can be arranged in an ascending order as shown below:
$30$ to $39 \rightarrow 37, 39$
$40$ to $49 \rightarrow 44, 48, 48$
$50$ to $59 \rightarrow 50, 52, 53, 55, 56, 58, 58, 59$
$60$ to $69 \rightarrow 60, 60, 60, 61, 62, 64, 67, 68$
$70$ to $79 \rightarrow 70, 75, 77, 78$
$80$ to $89 \rightarrow 84, 88$
$90$ to $99 \rightarrow 90, 98$
$100$ to $109 \rightarrow 100$
$ii.$ The highest score is $100$.
$iii.$ The lowest score is $37$.
$iv.$ The range is $100-37$, i.e. $63$.
$v.$ If $40$ is the passing mark, then the number of students who failed is $2 ($ i.e. $37, 39)$.
$vi.$ The number of students scoring $75$ and above is $8 ($ i.e. $75, 77, 78, 84, 88, 90, 98, 100)$.
$vii.$ The marks $51, 54,$ and $57$ do not actually appear between $50$ and $60$.
$viii.$ The number of students scoring less than $50$ is $5 ($ i.e. $37, 39, 44, 48, 48)$.
View full question & answer→Question 85 Marks
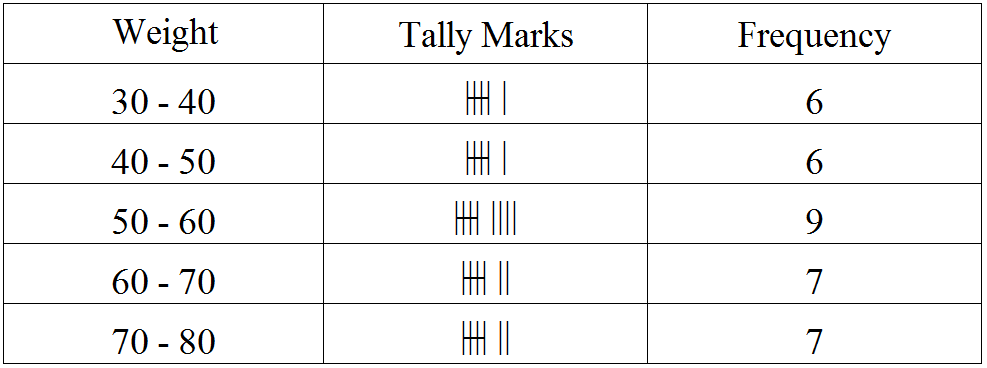
Construct a frequency table for the following weights $($in $gm)$ of $35$ mangoes using the equal class intervals, one of them is $40-50$ ($45$ not included):
$30, 40, 45, 32, 43, 50, 55, 62, 70, 70, 61, 62, 53, 52, 50, 42,$
$ 35, 37, 53, 55, 65, 70, 73, 74, 45, 46, 58, 59, 60, 62, 74, 34, 35, 70, 68$.
$i.$ What is the class mark of the class interval $40-45$?
$ii.$ What is the range of the above weights?
$iii.$ How many classes are there?
AnswerThe frequency table for the given weights $($in $gm)$ of $35$ mangoes is given below:
$i.$ Class mark for the class interval $40-45$:
Class mark $=\frac{40+45}{2}=\frac{85}{2}=42.5$
$ii.$ Range of the above weights:
Range $=$ Highest value $-$ Lowest value
$= 74 - 30$
$= 44$
$iii.$ There are $5$ classes $(30-40, 40-50, 50-60, 60-70, 70-80).$ View full question & answer→Question 95 Marks
The weights of new born babies $($in $kg)$ in a hospital on a particular day are as follows:$ 2.3, 2.2, 2.1, 2.7, 2.6, 3.0, 2.5, 2.9, 2.8, 3.1, 2.5, 2.8, 2.7, 2.9, 2.4.$
$i.$ Rearrange the weights in descending order.
$ii.$ Determine the highest weight.
$iii.$ Determine the lowest weight.
$iv.$ Determine the range.
$v.$ How many babies were born on that day?
$vi.$ How many babies weigh below $2.5 \ kg$?
$vii.$ How many babies weigh more than $2.8 \ kg$?
$viii.$ How many babies weigh $2.8 \ kg$?
AnswerThe frequency distribution of the weights of new born babies in a hospital on a particular day is represented in the following table:
$i.$ The weights of the newly born babies in descending order are as follows:
|
Weight
|
Tally marks
|
Frequency
|
|
$3.1$
|
$I$
|
$1$
|
|
$3.0$
|
$I$
|
$1$
|
|
$2.9$
|
$II$
|
$2$
|
|
$2.8$
|
$II$
|
$2$
|
|
$2.7$
|
$II$
|
$2$
|
|
$2.6$
|
$I$
|
$1$
|
|
$2.5$
|
$II$
|
$2$
|
|
$2.4$
|
$I$
|
$1$
|
|
$2.3$
|
$I$
|
$1$
|
|
$2.2$
|
$I$
|
$1$
|
|
$2.1$
|
$I$ |
$1$ |
$ii.$ The highest weight is $3.1\ kg$.
$iii.$ The lowest weight is $2.1\ kg$.
$iv.$ The range is $3.1-2.1,$ i.e. $1\ kg$.
$v.$ The number of babies born on that day is $15$.
$vi.$ The number of babies whose weights are below $2.5\ kg$ is $4 ($ i.e. $2.4, 2.3, 2.2, 2.1).$
$vii.$ The number of babies whose weights are more than $2.8\ kg$ is $4 ($ i.e. $3.1, 3.0, 2.9, 2.9).$
$viii.$The number of babies whose weight is $2.8\ kg$ is $2$. View full question & answer→