Question 15 Marks
The following table gives the distribution of students of two sections according to the marks obtained by them:
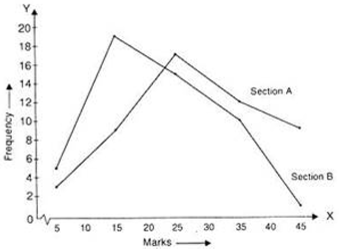
Represent the marks of the students of both the sections on the same graph by frequency polygons. From the two polygons compare the performance of the two sections.
| Section A | Section B | ||
| Marks | Frequency | Marks | Frequency |
| 0-10 | 3 | 0-10 | 5 |
| 10-20 | 9 | 10-20 | 19 |
| 20-30 | 17 | 20-30 | 15 |
| 30-40 | 12 | 30-40 | 10 |
| 40-50 | 9 | 40-50 | 1 |
Answer
View full question & answer→For section A
For section B
| Classes | Class-Marks | Frequency |
| 0-10 | 5 | 3 |
| 10-20 | 15 | 9 |
| 20-30 | 25 | 17 |
| 30-40 | 35 | 12 |
| 40-50 | 45 | 9 |
| Classes | Class-Marks | Frequency |
| 0-10 | 5 | 5 |
| 10-20 | 15 | 19 |
| 20-30 | 25 | 15 |
| 30-40 | 35 | 10 |
| 40-50 | 45 | 1 |