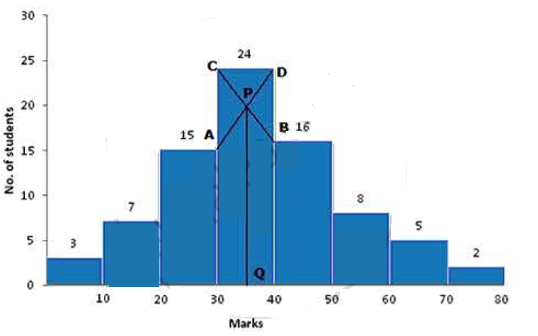
Question 15 Marks
Estimate the median, the lower quartile and the upper quartile of the following frequency distribution by drawing an ogive:
| Marks(more than) | 90 | 80 | 70 | 60 | 50 | 40 | 30 | 20 | 10 | 0 |
| No. of students | 6 | 13 | 22 | 34 | 48 | 60 | 70 | 78 | 80 | 80 |
Answer
View full question & answer→Given data is cumulative data , so draw the ogive as it is .
Take a graph paper and draw both the axes.
On the x-axis, take a scale of $1 cm =10$ to represent the marks (more than).
On the $y$ - axis, take a scale of $1 cm =10$ to represent the no. of students.
Now, plot the points $(0,80),(10,80),(20,78),(30,70)$, $(40,60),(50,48),(60,34),(70,22),(80,13),(90,6)$
Join them by a smooth curve to get the ogive.
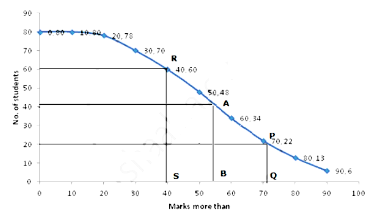
No. of terms $=80$
$ \therefore \text { Median }=\frac{40+41}{2}=40.5^{\text {th }} \text { term } $
Through mark of 40.5 on y-axis draw a line parallel to $x$-axis which meets the curve at $A$. From $A$, draw a perpendicular to $x$-axis which meets it at $B$.
The value of $B$ is the median which is 55 .
Lower Quartile $\left(Q_1\right)=\frac{n}{4}=\frac{80}{4}=20^{\text {th }}$ term
Through mark of 20 on $y$-axis draw a line parallel to xaxis which meets the curve at P. From P, draw a perpendicular to $x$-axis which meets it at $Q$.
The value of $Q$ is the lower quartile which is 71 .
Upper Quartile $\left(Q_3\right)=\frac{n \times 3}{4}=\frac{80 \times 3}{4}=60^{\text {th }}$ term
Through mark of 60 on $y$-axis draw a line parallel to $x$ axis which meets the curve at $R$. From $R$, draw a perpendicular to $x$-axis which meets it at $S$.
The value of $S$ is the upper Quartile which is 40 .
| Marks (more than) | No. of students (f) |
| 0 | 80 |
| 10 | 80 |
| 20 | 78 |
| 30 | 70 |
| 40 | 60 |
| 50 | 48 |
| 60 | 34 |
| 70 | 22 |
| 80 | 13 |
| 90 | 6 |
On the x-axis, take a scale of $1 cm =10$ to represent the marks (more than).
On the $y$ - axis, take a scale of $1 cm =10$ to represent the no. of students.
Now, plot the points $(0,80),(10,80),(20,78),(30,70)$, $(40,60),(50,48),(60,34),(70,22),(80,13),(90,6)$
Join them by a smooth curve to get the ogive.
No. of terms $=80$
$ \therefore \text { Median }=\frac{40+41}{2}=40.5^{\text {th }} \text { term } $
Through mark of 40.5 on y-axis draw a line parallel to $x$-axis which meets the curve at $A$. From $A$, draw a perpendicular to $x$-axis which meets it at $B$.
The value of $B$ is the median which is 55 .
Lower Quartile $\left(Q_1\right)=\frac{n}{4}=\frac{80}{4}=20^{\text {th }}$ term
Through mark of 20 on $y$-axis draw a line parallel to xaxis which meets the curve at P. From P, draw a perpendicular to $x$-axis which meets it at $Q$.
The value of $Q$ is the lower quartile which is 71 .
Upper Quartile $\left(Q_3\right)=\frac{n \times 3}{4}=\frac{80 \times 3}{4}=60^{\text {th }}$ term
Through mark of 60 on $y$-axis draw a line parallel to $x$ axis which meets the curve at $R$. From $R$, draw a perpendicular to $x$-axis which meets it at $S$.
The value of $S$ is the upper Quartile which is 40 .
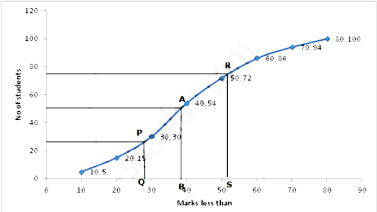
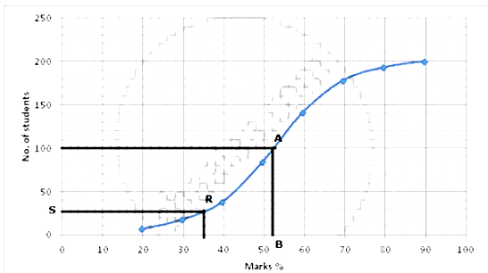 (i) No. of terms = 200
$\therefore$ Median $=\frac{100+101}{2}=100.5^{\text {th }}$ term
Through mark of 100.5 on y-axis draw a line parallel to x-axis which meets the curve at A. From A, draw a perpendicular to x-axis which meets it at B.
The value of B is the median which is 52.
(ii) From marks % = 35 draw a line parallel to y-axis and meet the curve at R. From R, Draw a perpendicular on y-axis which meets it at S. The difference of the value obtained when subtracted from 200 gives the number of students who scored more than 35%.
⇒ 200 - 23 = 172
172 students scored more than 35 %
(i) No. of terms = 200
$\therefore$ Median $=\frac{100+101}{2}=100.5^{\text {th }}$ term
Through mark of 100.5 on y-axis draw a line parallel to x-axis which meets the curve at A. From A, draw a perpendicular to x-axis which meets it at B.
The value of B is the median which is 52.
(ii) From marks % = 35 draw a line parallel to y-axis and meet the curve at R. From R, Draw a perpendicular on y-axis which meets it at S. The difference of the value obtained when subtracted from 200 gives the number of students who scored more than 35%.
⇒ 200 - 23 = 172
172 students scored more than 35 %