Question 15 Marks
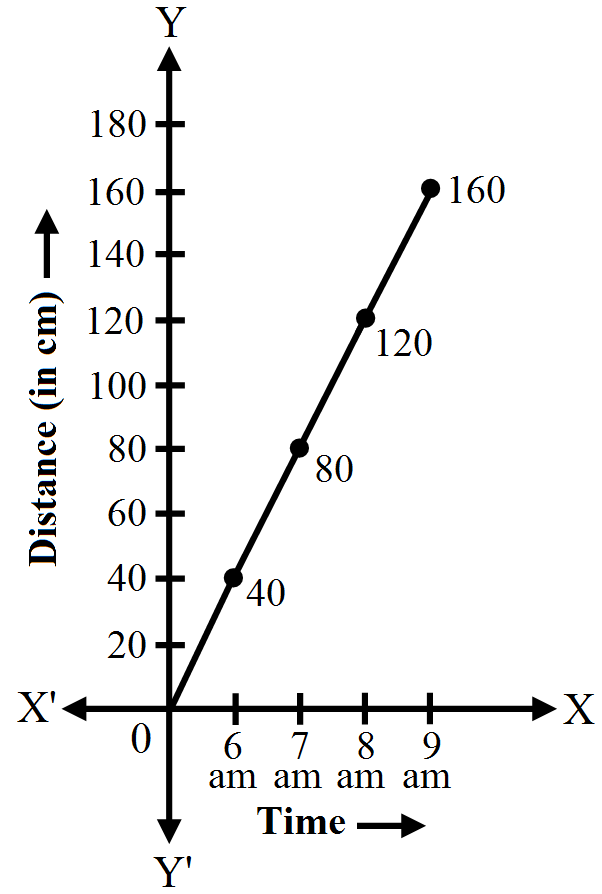
A car is travelling from city $P$ to city $Q$, which are $350\ km$ apart. The line graph given below describes the distances of the car from the city $P$ at different times.
Study the above graph and answer the questions given below:
$i.$ What information is given on the two axes?
$ii.$ From where and when did the car begin its journey?
$iii.$ How far dis the car go in the first hour?
$iv.$ How far did the car go during $(a)$ the $2^{nd}$ hour and $(b)$ the $3^{rd}$ hour?
$v.$ Was the speed same during first three hours? How do you know it?
$vi.$ Did the car stop for some during at any place? Justify your answer.
$vii.$ When did the car reach city $Q?$
Answer
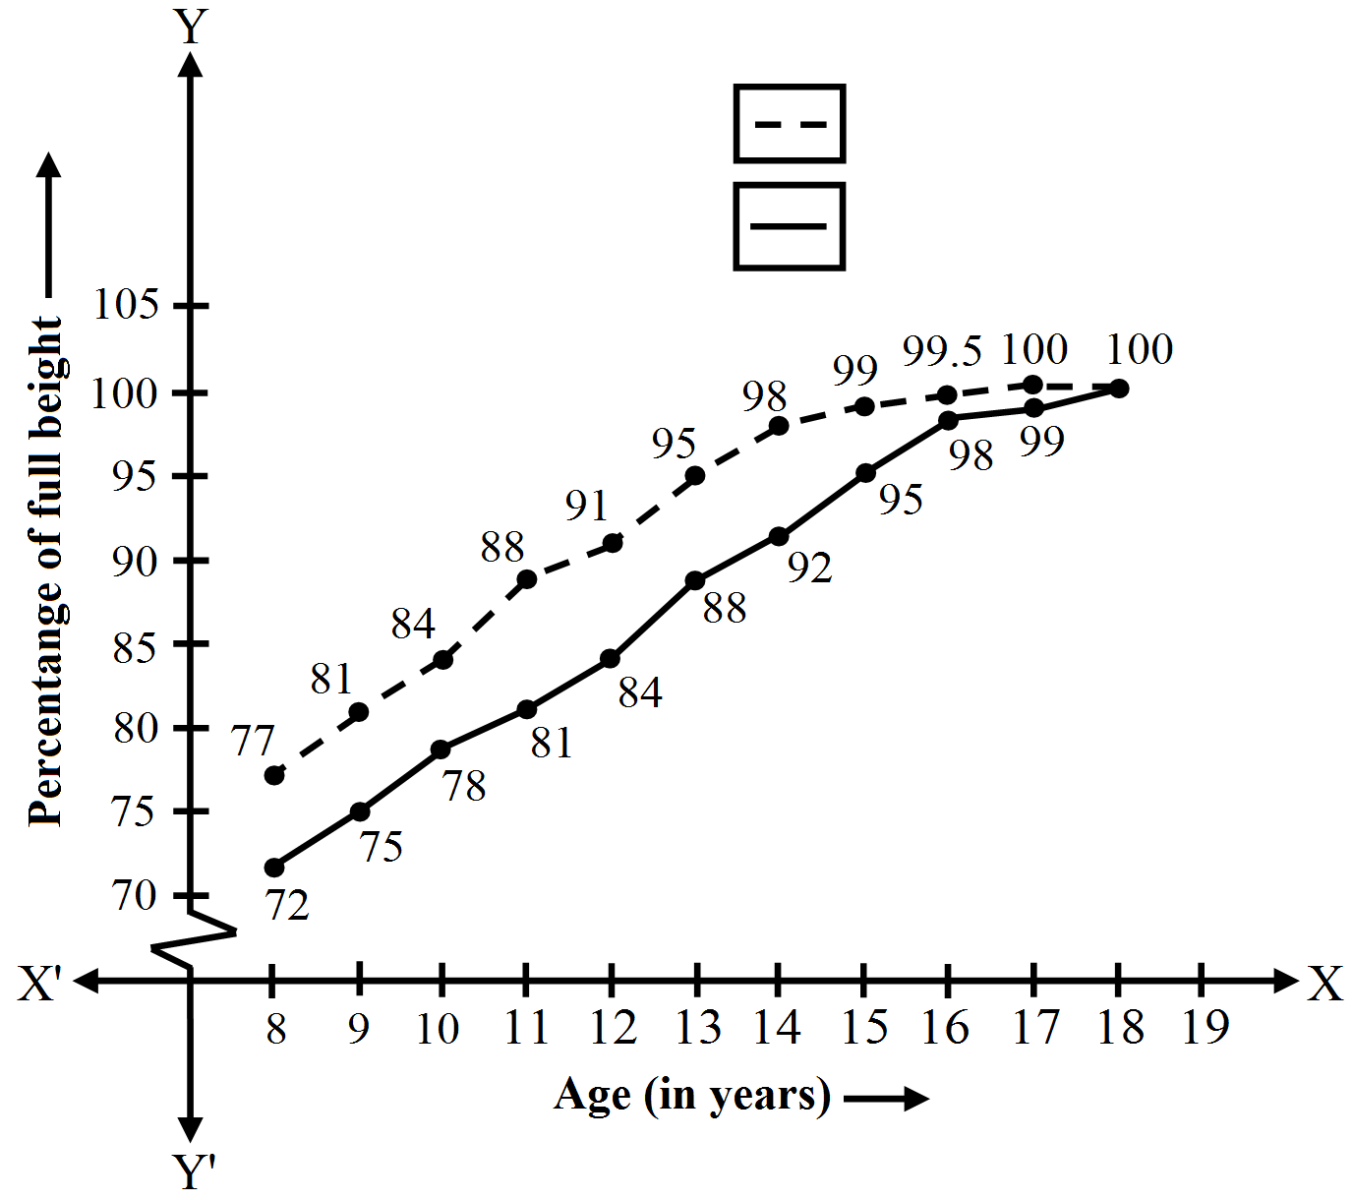
View full question & answer→$1.$ Both boys and girls achieve their maximum height in $18^{th}$ years.
$2.$ Boys grows faster than girls in puberty.
$2.$ Boys grows faster than girls in puberty.

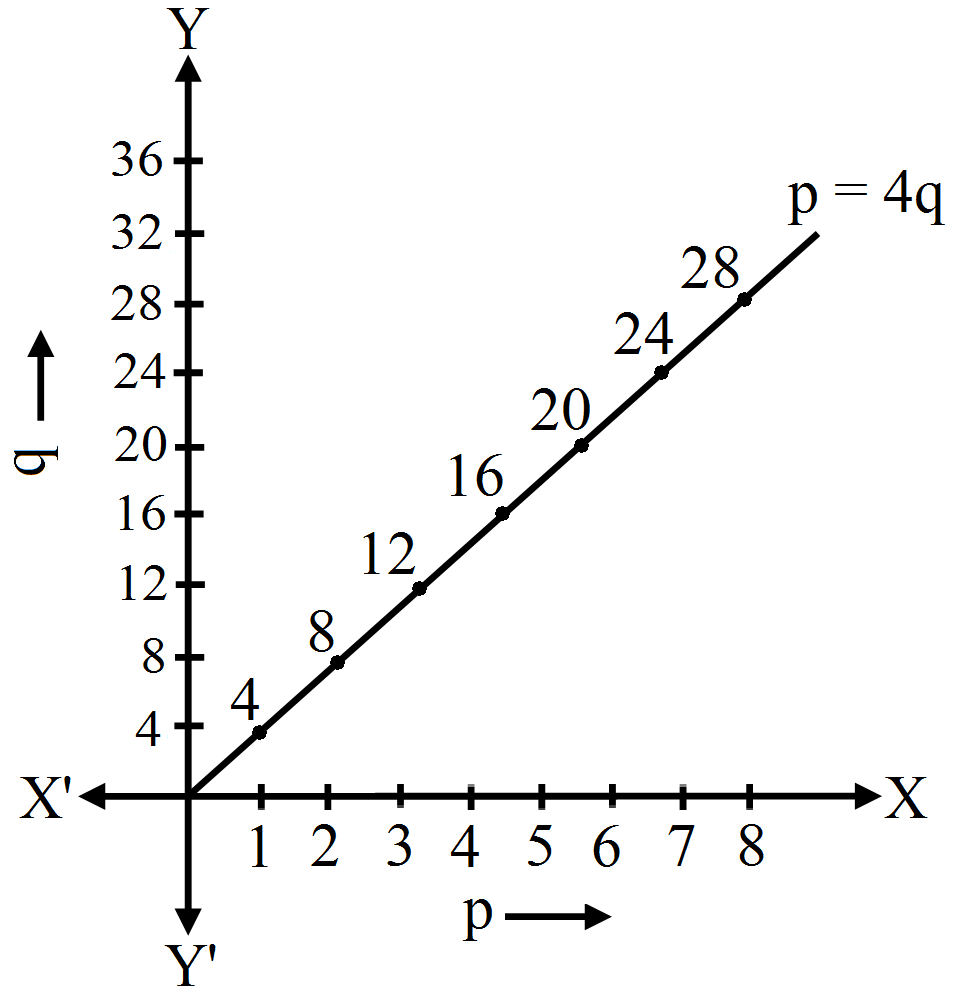
 No, the drawn graph is not linear.