Question 13 Marks
A group of $360$ people were asked to vote for their favourite season from the three seasons rainy, winter and summer.
Draw a pie chart to show this information.
| Season | No. of votes |
|---|---|
Summer  |
$90$ |
Rainy  |
$120$ |
Winter  |
$150$ |
Answer
View full question & answer→The required pie chart can be shown as below:
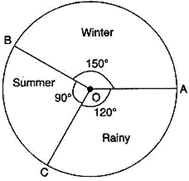
| Season | People who voted for it | In fraction | fractions of $360^\circ$ |
| Winter | $150$ | $\frac{5}{12}$ | $\frac{5}{12}$ of $360^\circ = 150^\circ$ |
| Summer | $90$ | $\frac{1}{4}$ | $\frac{1}{4}$ of $360^\circ = 90^\circ$ |
| Rainy | $120$ | $\frac{1}{3}$ | $\frac{1}{3}$ of $360^\circ = 120^\circ$ |