MCQ 11 Mark
When a dice is thrown, outcomes $1, 2, 3, 4, 5, 6$ are___________.
AnswerWhen a dice is thrown, outcomes $1, 2, 3, 4, 5, 6$ are equally likely.
View full question & answer→MCQ 21 Mark
Study the following frequency distribution table and answer the questions given below:
|
Class interval Age (in years)
|
Number of Persons
|
|
$15-20$
|
$12$
|
|
$20-25$
|
$20$
|
|
$25-30$
|
$42$
|
|
$30-35$
|
$20$
|
|
$35-40$
|
$6$
|
What is the lower limit of the class interval $35-40?$ View full question & answer→MCQ 31 Mark
Tick the correct answer in the following:
In a spinning wheel, there are $3$ white and $5$ green sectors. It is spinned. What is the probability of getting a green sector?
- A
$\frac{5}{3}$
- ✓
$\frac{5}{8}$
- C
$\frac{1}{5}$
- D
$\frac{3}{8}$
AnswerCorrect option: B. $\frac{5}{8}$
A spinning wheek has $3$ white and $5$ green sectors possible out come $= 3 + 5 = 8$
It is spinners, then
Probability of getting a green sector $=\frac{5}{8}$
View full question & answer→MCQ 41 Mark
There are $2$ Red, $3$ Blue and $5$ Black balls in a bag. A ball is drawn from the bag without looking in to the bag. What is the probability of getting a blue ball?
- A
$\frac{3}{5}$
- B
$\frac{2}{5}$
- ✓
$\frac{3}{10}$
- D
AnswerCorrect option: C. $\frac{3}{10}$
$\frac{3}{10}$
View full question & answer→MCQ 51 Mark
Observe the following bar graph carefully and answer the following questions:

Which two subjects have the same number of books?
- A
- B
- ✓
- D
Science and Social Science.
AnswerEnglish → $200$
Science → $200$
View full question & answer→MCQ 61 Mark
Which of the following is not a random experiment?
- A
- B
- C
Drawing a card from a well shuffled pack of 52 card
- ✓
AnswerRolling an unbiased dice results in $6$ outcomes. All have equal probability of showing up.
Tossing a fair coin results in $2$ outcomes. Both have equal probabilities of showing up.
Drawing a card from from a well shuffled pack of $52$ cards can have $52$ outcomes in total with equal probabilities.
Hence, above all are example of random experiment.
View full question & answer→MCQ 71 Mark
Study the following frequency distribution table and answer the questions given below:
|
Class interval Age (in years)
|
Number of Persons
|
|
$15-20$
|
$12$
|
|
$20-25$
|
$20$
|
|
$25-30$
|
$42$
|
|
$30-35$
|
$20$
|
|
$35-40$
|
$6$
|
Which class has the highest frequency? - A
$15-20$
- B
$20-25$
- ✓
$25-30$
- D
$35-40$
AnswerCorrect option: C. $25-30$
Highest frequency $= 42 \rightarrow 25 – 30.$
View full question & answer→MCQ 81 Mark
Observe the following bar graph carefully and answer the following questions:

The total number of books is:
- ✓
$1200$
- B
$1400$
- C
$1600$
- D
$1800$
AnswerCorrect option: A. $1200$
$300 + 400 + 200 + 200 + 100 = 1200$
View full question & answer→MCQ 91 Mark
The probability of an event that cannot happen is ____?
AnswerWe know that. all probabilities are between $0$ and $1$ inclusive.
A probability of $0$ means an event is impossible, it cannot happen.
A probability of $1$ means an event is certain to happen, it must happen.
Thus the probability of an event that cannot happen is $0.$
View full question & answer→MCQ 101 Mark
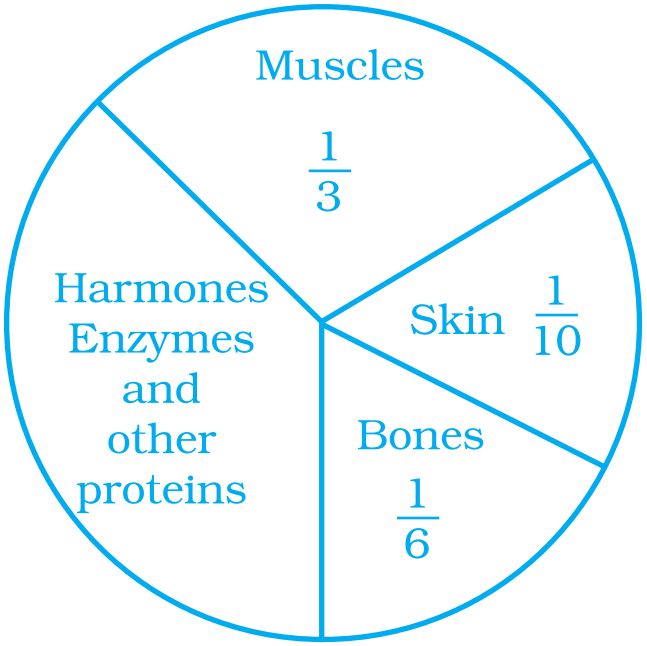
What is the central angle of the sector (in the above pie chart) representing hormones enzymes and other proteins.
- A
$120^\circ$
- ✓
$144^\circ$
- C
$156^\circ$
- D
$176^\circ$
AnswerCorrect option: B. $144^\circ$
B. $144^\circ$
Solution:
The protion representing hormones enzymes and other proteins $=1-\Big(\frac{1}{3}+\frac{1}{10}+\frac{1}{6}\Big)$
$=1-\Big(\frac{20+6+10}{60}\Big)$
$=1-\frac{36}{60}$
$=\frac{60-36}{60}$
$=\frac{2}{5}$
Central angle of the sector representing hormones enzymes and other proteins $=\frac{2}{5}\times360^\circ$
$=144^\circ$
View full question & answer→MCQ 111 Mark
Observe the histogram and answer the questions given below:
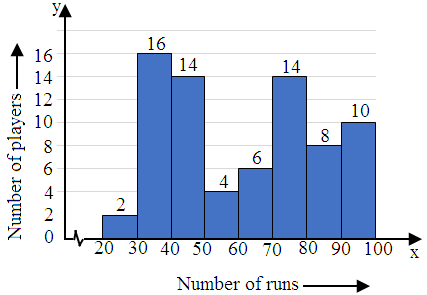
How many players make runs $80$ and above? AnswerRequired number $= 8 + 10 = 18$
View full question & answer→MCQ 121 Mark
The difference between the upper$-$class limit and lower class limit of a class interval is called:
View full question & answer→MCQ 131 Mark
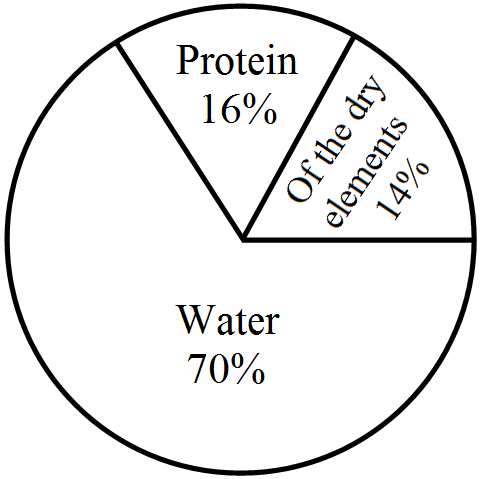
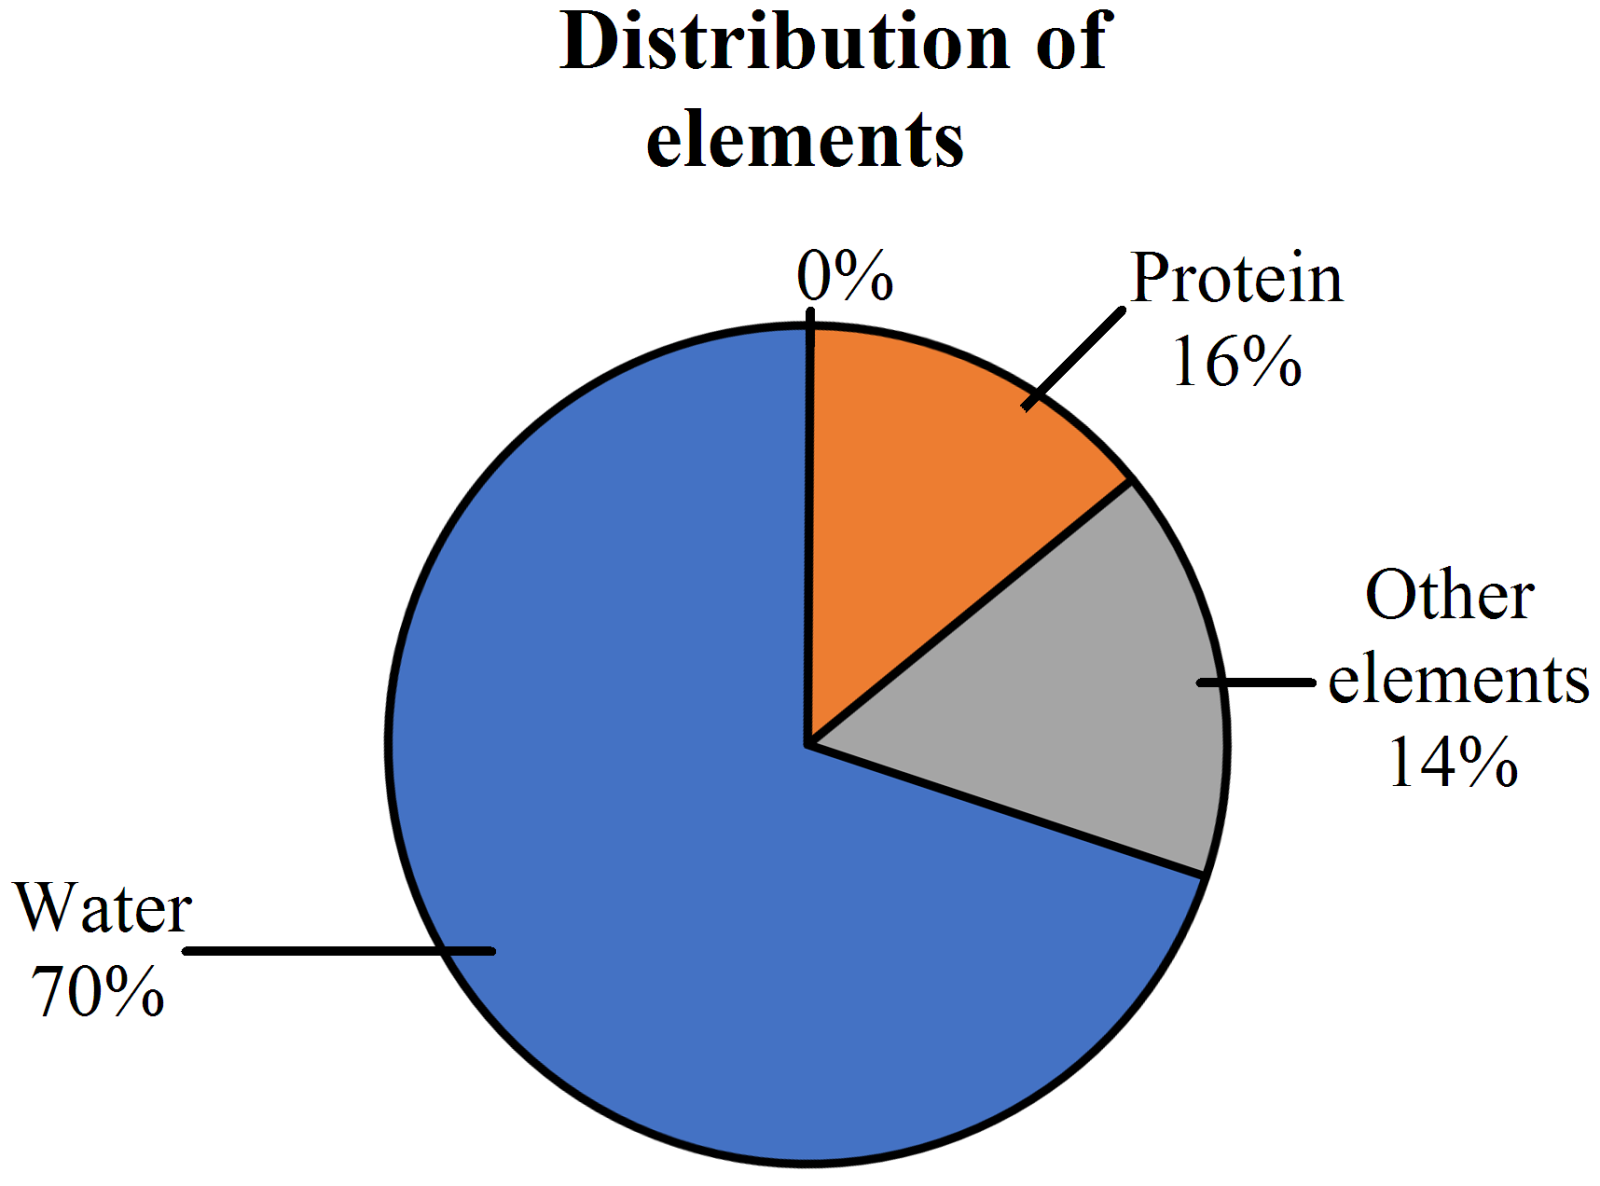
The following pie chart gives the distribution of constituents in the human body. The central angle of the sector showing the distribution of protein and other constituents is:
- ✓
$108^\circ$
- B
$54^\circ$
- C
$30^\circ$
- D
$216^\circ$
AnswerCorrect option: A. $108^\circ$
A. $108^\circ$
Solution:
Distribution of protein and other constituents in human body $= 16 + 14 = 30\ %$
Central angle of the sector showing the distribution of protein and other constituents
$\frac{30}{100}\times360^\circ$
$=108^\circ$
View full question & answer→MCQ 141 Mark
Study the following frequency distribution table and answer the questions given below:
|
Daily wages
|
Number of works
|
|
$290-325$
|
$5$
|
|
$325-360$
|
$2$
|
|
$360-395$
|
$4$
|
|
$395-430$
|
$6$
|
|
$430-465$
|
$7$
|
|
$465-500$
|
$5$
|
Which two classes have the same frequency? - ✓
$290-325$ and $465-500$
- B
$290-325$ and $325-360$
- C
$430-465$ and $465-500$
- D
$325-360$ and $360-395$
AnswerCorrect option: A. $290-325$ and $465-500$
Frequency of class $290-325$
= Frequency of class $465-500 = 5$
View full question & answer→MCQ 151 Mark
Study the following frequency distribution table and answer the questions given below:
|
Class interval Age (in years)
|
Number of Persons
|
|
$15-20$
|
$12$
|
|
$20-25$
|
$20$
|
|
$25-30$
|
$42$
|
|
$30-35$
|
$20$
|
|
$35-40$
|
$6$
|
The difference between the frequencies of the class intervals $20-25$ and $30-35$ is: AnswerFrequency of class $20-25 = 20$
Frequency of class $30-35 = 20$
$\therefore$ Difference $= 20 - 20 = 0$
View full question & answer→MCQ 161 Mark
The number of times an observation occurs in a data is called its:
MCQ 171 Mark
The range of the data: $6, 14, 20, 16, 6, 5, 4, 18, 25, 15$, and $5$ is:
View full question & answer→MCQ 181 Mark
Observe the following bar graph carefully and answer the following questions:

The difference of the number of books of Hindi and Social Science is:
MCQ 191 Mark
There are $5$ red balls and $4$ blue balls in a bag. What is the probability of getting a red ball?
- A
$\frac{5}{4}$
- B
$\frac{4}{5}$
- C
$\frac{4}{9}$
- ✓
$\frac{5}{9}$
AnswerCorrect option: D. $\frac{5}{9}$
Number of red balls in the bag = favourable outcomes $= 5$
Total number of balls in the bag $= 5 - 4 = 9$
Probability (getting a red ball) $=\frac{\text{favourable outcomes}}{\text{Total outcomes}}$
P (red ball) $=\frac{5}{9}$
View full question & answer→MCQ 201 Mark
Which of the following is a reasonable conclusion for the given data?
AnswerCorrect option: D. Number of students liking together yellow and green colour is approximately the same as those for red colour.
Number of students liking together yellow and green colours is $(14 + 20)\%$ i.e. $34\%$, which is approximately the same as those for red $(35\%).$
View full question & answer→MCQ 211 Mark
A diece is tossed two times. The number of possible outcomes is:
AnswerNumber of possible outcomes is 36,
i.e. $(1, 1), (1, 2), (1, 3), (1, 4), (1, 5), (1, 6)$
$(3,1), (3, 2), (3, 3), … (3, 6)$
$(4, 1), (4, 2), … (4, 6)$
$(5, 1), (5, 2), … (5, 6)$
$(6,1), (6, 2), … (6, 6)$
View full question & answer→MCQ 221 Mark
In any pie chart the sum of the central angles is:
- A
$90^\circ$
- B
$180^\circ$
- C
$270^\circ$
- ✓
$360^\circ$
AnswerCorrect option: D. $360^\circ$
A pie chart is in the shape of a circle.
Hence, the sum of all central angles is equal to the complete angle of a circle, which is $360^\circ .$
Thus, in any pie chart the sum of the central angles is $360^\circ .$
View full question & answer→MCQ 231 Mark
Observe the histogram and answer the questions given below:
The number of students getting marks less than $4$ is: AnswerRequired number $= 7 + 8 = 15$
View full question & answer→MCQ 241 Mark
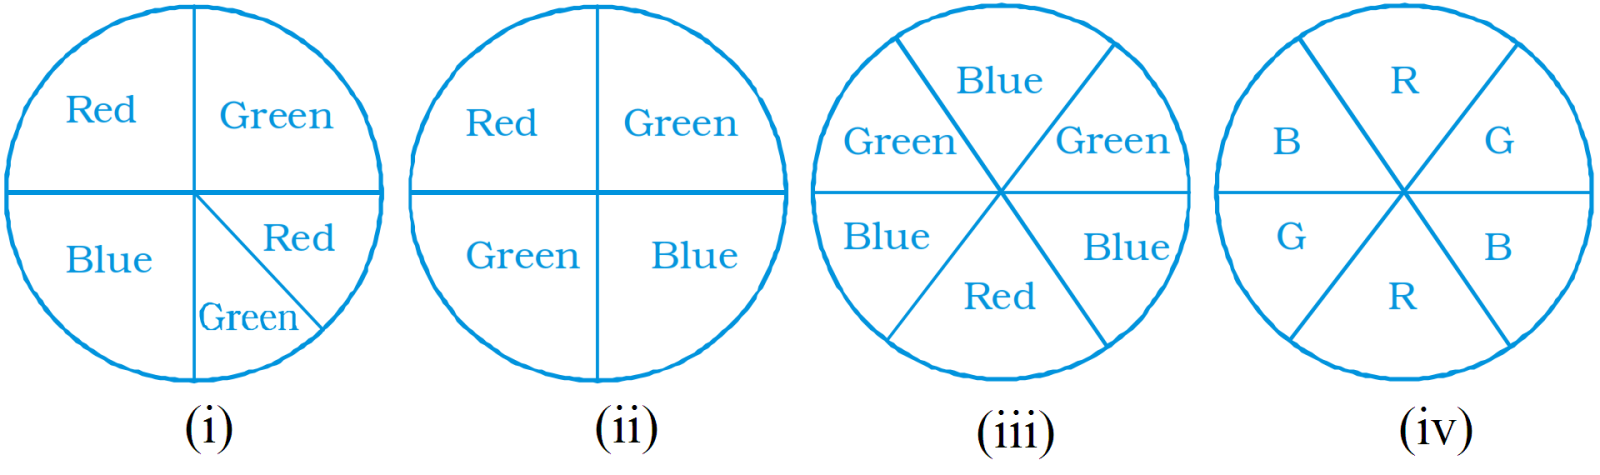
Rahul, Varun and Yash are playing a game of spinning a coloured wheel. Rahul wins if spinner lands on red. Varun wins if spinner lands on blue and Yash wins if it lands on green. Which of the following spinner should be used to make the game fair?
- A
$(i)$
- B
$(ii)$
- C
$(iii)$
- ✓
$(iv)$
AnswerCorrect option: D. $(iv)$
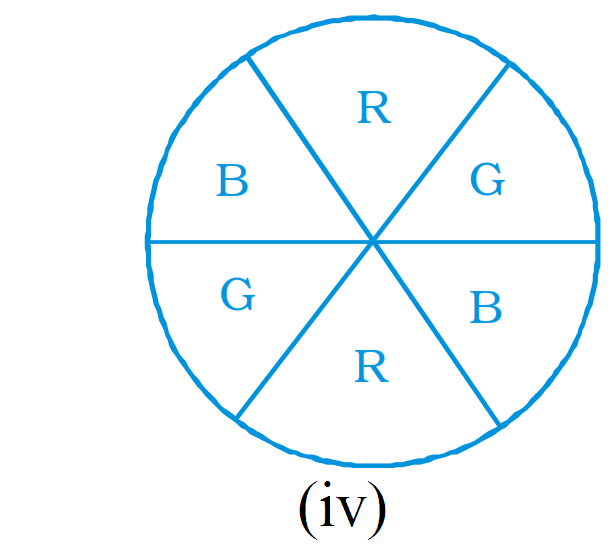
The figure $(iv)$ should be selected to make the game fair as the area occupied by each colour is equal. Hence, the chance of winning for each person is equal. View full question & answer→MCQ 251 Mark
Observe the histogram and answer the questions given below:

The number of students getting marks in the groups $4-6$ or $8-10$ is: AnswerRequired number $= 4 + 2 = 6$
View full question & answer→MCQ 261 Mark
The difference between the highest and the lowest value of the observations in a data is called:
AnswerWe know that,
Range $=$ Highest observation $-$ Lowest observation
The difference between the highest and lowest values of the observations is called the range.
View full question & answer→MCQ 271 Mark
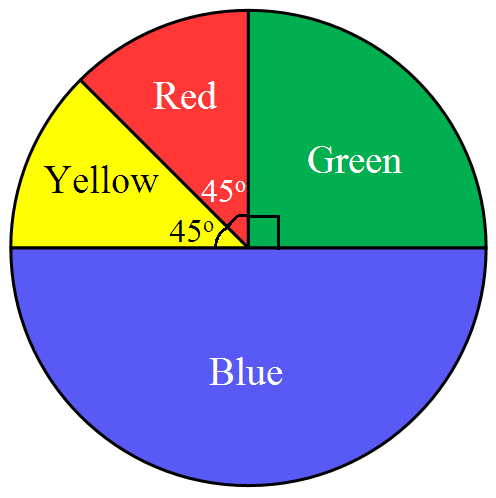
Observe the pie chart and answer the following questions:

The diffrence of the central angles for green and blue is:
- A
$45^\circ $
- ✓
$90^\circ $
- C
$180^\circ $
- D
$22 \frac{1}{2}^\circ$
AnswerCorrect option: B. $90^\circ $
Central angle for blue $= 180^\circ $
Central angle for green $= 90^\circ $
$\therefore$ Difference $= 180^\circ - 90^\circ = 90^\circ $
View full question & answer→MCQ 281 Mark
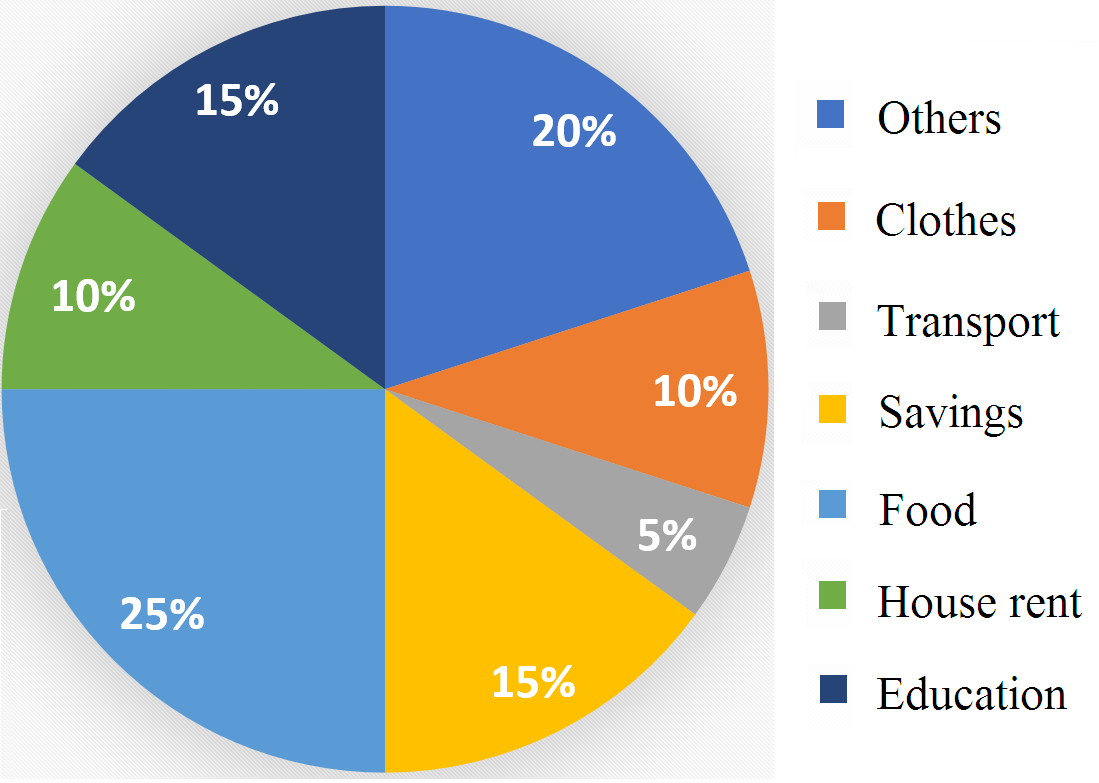
If 400 students voted in all, then how many did vote ‘Others’ colour as their favourite?
AnswerIf total number of votes $= 400$
Then, number of votes in favour of ‘Others’ $= 6\%$ of 400 $=\frac{6}{100}\times400$
$=\frac{3}{50}\times400$
$=24$
View full question & answer→MCQ 291 Mark
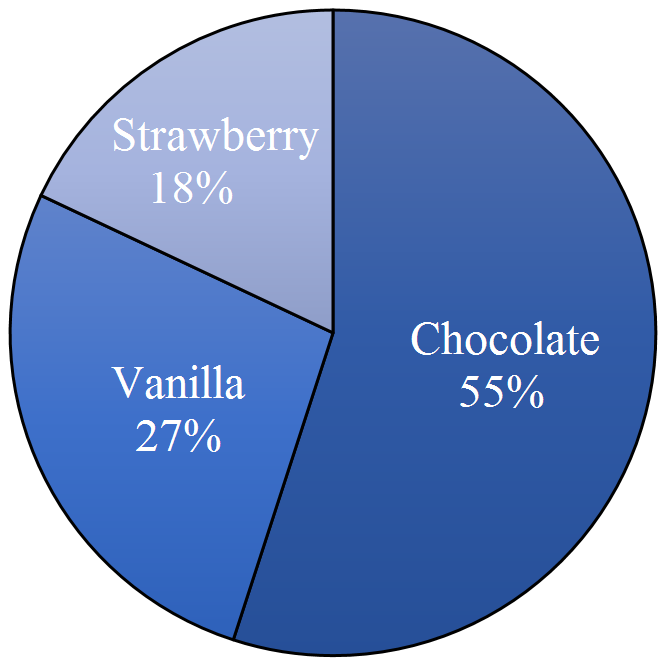
The distribution of favorite ice-cream flavor is represented by the following pie chart. The angle of the sector showing the distribution of vanilla flavor is:
- ✓
$97.2^\circ $
- B
$97^\circ $
- C
$98^\circ $
- D
$97.5^\circ$
AnswerCorrect option: A. $97.2^\circ $
So, angle of the sector $\frac{27}{100}\times360^\circ = 97.2^\circ$
View full question & answer→MCQ 301 Mark
The probability of _________ event is $1$.
AnswerThe probability of a sure event is $1.$
View full question & answer→MCQ 311 Mark
What are the possible number of outcomes if a card is drawn from a pack of $52$ cards?
View full question & answer→MCQ 321 Mark
The probability of $.............$ event is $0.$
AnswerThe probability of an impossible event is $0.$
View full question & answer→MCQ 331 Mark
What is the difference of expenditures done on conveyance and rent?
- A
Rs. $1000$
- ✓
Rs.$ 2000$
- C
Rs.$ 3000$
- D
Rs. $4000$
AnswerCorrect option: B. Rs.$ 2000$
Expenditure done on conveyance
$= 6 \times 1000 = Rs. 6000$
Expenditure done on rent $= 4 \times 1000$
$= Rs. 4000$
$\therefore$ Difference $= Rs. 6000 – Rs. 4000$
$= Rs. 2000.$
View full question & answer→MCQ 341 Mark
The probability of an event that is certain to happen is ____?
AnswerThe event that is sure to happen is called a certain event and probability of such an event is $1$ as this event is bound to happen.
View full question & answer→MCQ 351 Mark
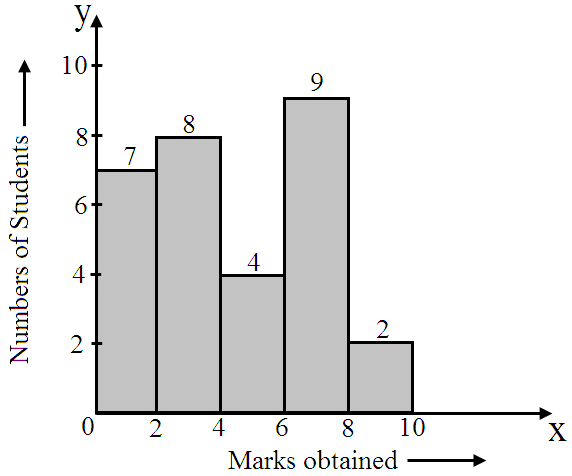
Observe the histogram and answer the questions given below:

The total number of students is:
AnswerTotal number of students
$= 7 + 8 + 4 + 9 + 2 = 30$
View full question & answer→MCQ 361 Mark
Observe the following bar graph carefully and answer the following questions:

Of which subject are there the minimum books?
AnswerThe height of the bar corresponding to Social Science is minimum.
View full question & answer→MCQ 371 Mark
Double bar graphs display $..........$ sets of data simultaneously.
View full question & answer→MCQ 381 Mark
The distribution of constituents in human body is represented by the following pie chart, The angle of the sector showing the distribution of protein and other constituents is:
- ✓
$108^\circ$
- B
$54^\circ$
- C
$50^\circ$
- D
$30^\circ$
AnswerCorrect option: A. $108^\circ$
Percentage of protein and other constituents in human body $= 16\% + 14\% = 30\%$
So, angle of the sector $= \frac{30}{100}\times 360^\circ = 108^\circ$
View full question & answer→MCQ 391 Mark
Check the given table, and give the correct answers to the following questions.
|
Range of Marks Obtained
|
Number of students
|
|
$250–300$
|
$10$
|
|
$300–350$
|
$12$
|
|
$350–400$
|
$14$
|
|
$400–450$
|
$13$
|
|
$450–500$
|
$11$
|
What is the upper limit in the given frequency distribution table? AnswerThe last class has the upper limit of $500$, which is the upper limit for the whole table.
View full question & answer→MCQ 401 Mark
Observe the pie chart and answer the following questions:

Which colour has the greatest central angle?
MCQ 411 Mark
The following pie chart represents the distribution of proteins in parts of a human body. What is the ratio of distribution of proteins in the muscles to that of proteins in the bones?
- A
$3 : 1$
- B
$1 : 2$
- C
$1 : 3$
- ✓
$2 : 1$
AnswerCorrect option: D. $2 : 1$
Distribution of protein in muscles $=\frac{1}{3}$
Distribution of protein in bones $=\frac{1}{6}$
Ratio of distribution of proteins in the muscles to that of proteins in the bones.
$=\frac{1}{3}:\frac{1}{5}$
$=\frac{1}{3}\times\frac{1}{5}$
$=2:1$
View full question & answer→MCQ 421 Mark
Rs. $5000$ is the expenditure done on:
Answer$\frac{5000}{1000} = 5\ cm$ is the hight of the bar corresponding to food.
View full question & answer→MCQ 431 Mark
Which of the following are impossible events?
- A
- B
- C
Tossing coin giving outcome head
- ✓
Both $(a)$ and $(b).$
AnswerCorrect option: D. Both $(a)$ and $(b).$
Sun rises in the East → option $A$ is an impossible event
Sun sets in the West → option $B$ is an impossible event
A tossing coin can give output as head → possible event
A rolled die can give outcome $6$ → possible event
View full question & answer→MCQ 441 Mark
Tick $(\checkmark)$ the correct answer in the following:
If in the pie chart representing the number of students opting for different streams of study out of a total strength of $1650$ students, the central angle of the sector representing arts students is $48^\circ $ then what is the number of students who opted for arts stream?
AnswerLet the required number of students be $x.$
Then we have:
$\Rightarrow\frac{\text{x}}{1650}\times48$
$\Rightarrow\text{x}=\Big(48\times\frac{\text{1650}}{360}\Big)$
$\Rightarrow\text{x}=220$
Hence, the number of students who opted for arts stream is $220.$
View full question & answer→MCQ 451 Mark
A geometric representation showing the relationship between a whole and its parts is a:
AnswerData can also be represented by using a pie chart $($circle graph$)$, It shows the relationship between a whole and its parts.
View full question & answer→MCQ 461 Mark
Rs. $6000$ is the expenditure done on:
Answer$\frac{6000}{1000} = 6\ cm$ is the hight of the bar corresponding to conveyance.
View full question & answer→MCQ 471 Mark
The given graph shows the number of workers working in the day and the night shift in a factory in a particular week. Find the total workers in both the shift on tuesday and thursday taken together.
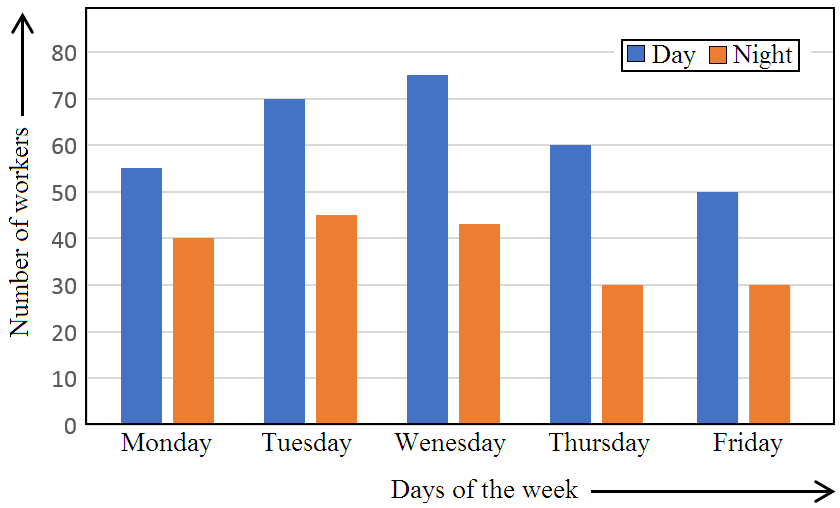
AnswerOn tuesday the number of workers in both the shift $= 70 + 45 = 115$
On thursday the number of workers in both the shift $= 60 + 30 = 90$
The total number of workers on both the days taken together $= 115 + 90 = 205$
View full question & answer→MCQ 481 Mark
Observe the histogram and answer the questions given below:

The number of students getting marks 6-8 is greater than the number of students getting marks $2-4$ by: AnswerRequired difference $= 9 - 8 = 1$
View full question & answer→MCQ 491 Mark
The range of the data: $6, 14, 20, 16, 6, 5, 4, 18, 25, 15$, and $5$ is:
AnswerThe range of a data set is the difference between the highest and lowest value in a data set.
Data is $6, 14, 20, 16, 6, 5, 4, 18, 25, 15, 5$
The largest value of data set $= 25$
The smallest value of data set $= 4$
Range $= 25 - 4 = 21$
View full question & answer→MCQ 501 Mark
How many more cupcakes were sold on monday than on tuesday in a bakery?
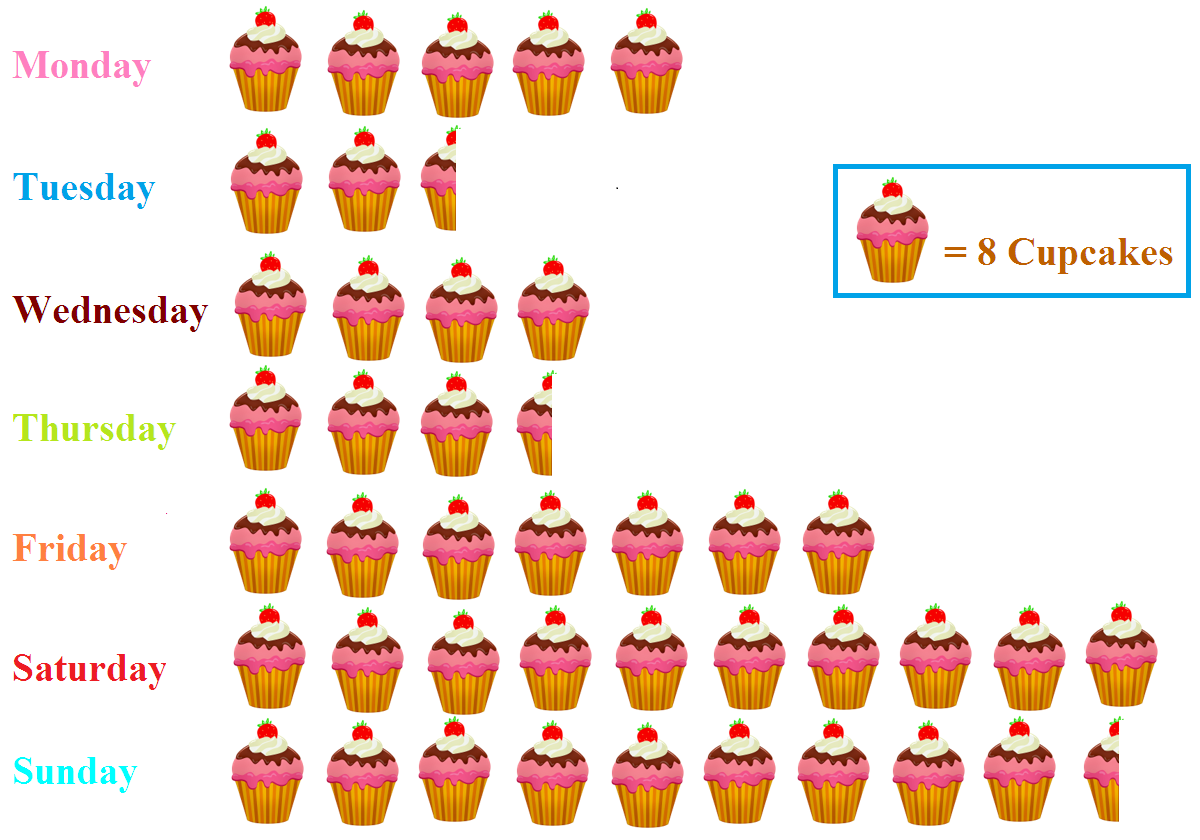
AnswerNumber of cupcakes on monday $= 5 \times 8 = 40$
Number of cupcakes on tuesday $= 2\times8+\frac{1}{2}\times8 = 16 + 4 = 20$
The difference between the number of cupcakes sold on monday and tuesday $= 40 - 20 = 20$
View full question & answer→MCQ 511 Mark
A coin is tossed $200$ times and head appeared $120$ times. The probability of getting a head in this experiment is:
- A
$\frac{2}{5}$
- ✓
$\frac{3}{5}$
- C
$\frac{1}{5}$
- D
$\frac{4}{5}$
AnswerCorrect option: B. $\frac{3}{5}$
Given, head appeared $120$ times, if a coin is tossed $200$ times. Then,
probability of getting a head in this experiment $=\frac{\text{Number of times head appeared}}{\text{Number of times coin is tossed}}$
$=\frac{120}{200}$
$=\frac{3}{5}$
View full question & answer→MCQ 521 Mark
Observe the histogram and answer the questions given below:

Which two groups have the same number of players?
- A
$30-40$ and $40-50$
- B
$20-30$ and $30-40$
- ✓
$40-50$ and $70-80$
- D
$80-90$ and $90-100$
AnswerCorrect option: C. $40-50$ and $70-80$
Frequency of group $40-50 = 14$
$=$ Frequency of group $70-80$
View full question & answer→MCQ 531 Mark
Which of the following is the probability of an impossible event?
AnswerImpossible event is an event that is non existing. There is no possibility that it can happen. Hence the probability of occurrence is $0.$
View full question & answer→MCQ 541 Mark
Check the given table, and give the correct answers to the following questions.
|
Range of Marks Obtained
|
Number of students
|
|
$250–300$
|
$10$
|
|
$300–350$
|
$12$
|
|
$350–400$
|
$14$
|
|
$400–450$
|
$13$
|
|
$450–500$
|
$11$
|
When two coins are tossed, then what is the probability of getting Tails for both the coins? - ✓
$\frac{1}{4}$
- B
$\frac{1}{3}$
- C
$\frac{1}{2}$
- D
AnswerCorrect option: A. $\frac{1}{4}$
When two coins are tossed, then the possible outcomes will be:
$HH, HT, TH, TT$
Thus, probability of getting tails for both the coins $=\frac{1}{4}$
View full question & answer→MCQ 551 Mark
A coin is tossed. Which of the following is the probability of getting a head or tail?
MCQ 561 Mark
Data represented using circles is known as:
AnswerData represented using circles is known as pie chart.
Note Bar graph Data using bars of different heights in a graphical display is known as bar graph $($bar chart$).$
Histogram Grouped data can be represented by a histogram.
Pictograph Data using pictures and symbols to represent the statistical information is known as pictograph.
View full question & answer→MCQ 571 Mark
What is probability to get atleast one tail when two coins are tossed simultaneously?
- A
$\frac{1}{2}$
- ✓
$\frac{3}{4}$
- C
$1$
- D
$\frac{1}{4}$
AnswerCorrect option: B. $\frac{3}{4}$
View full question & answer→MCQ 581 Mark
The pie chart is divided into $.............$
AnswerPie chart is divided into sector.
View full question & answer→MCQ 591 Mark
Observe the histogram and answer the questions given below:

How many players make runs $50$ to less than $60?$ AnswerRequired number
$=$ Frequency of group $50-60 = 4$
View full question & answer→MCQ 601 Mark
Tick the correct answer in the following:
Two coins are tossed simultaneously. What is the probability of getting one head and one tail?
- A
$\frac{1}{4}$
- ✓
$\frac{1}{2}$
- C
$\frac{3}{4}$
- D
$\frac{2}{3}$
AnswerCorrect option: B. $\frac{1}{2}$
Two coins are tossed simultaneously, then possible outcomes $= 4$
Now probability of getting one head and one tail $=\frac{2}{4}=\frac{1}{2}$
View full question & answer→MCQ 611 Mark
The number of times a particular observation occurs in a given data is called:
AnswerAccording to the definition, the number of times a particular observation occurs is called its frequency.
View full question & answer→MCQ 621 Mark
Check the given table, and give the correct answers to the following questions.
|
Range of Marks Obtained
|
Number of students
|
|
$250–300$
|
$10$
|
|
$300–350$
|
$12$
|
|
$350–400$
|
$14$
|
|
$400–450$
|
$13$
|
|
$450–500$
|
$11$
|
What is the size of the class interval? AnswerExplanation: For any class, we can determine the class interval, by subtracting the lower limit from upper limit.
$500 - 450 = 50$
$450 - 400 = 50$
View full question & answer→MCQ 631 Mark
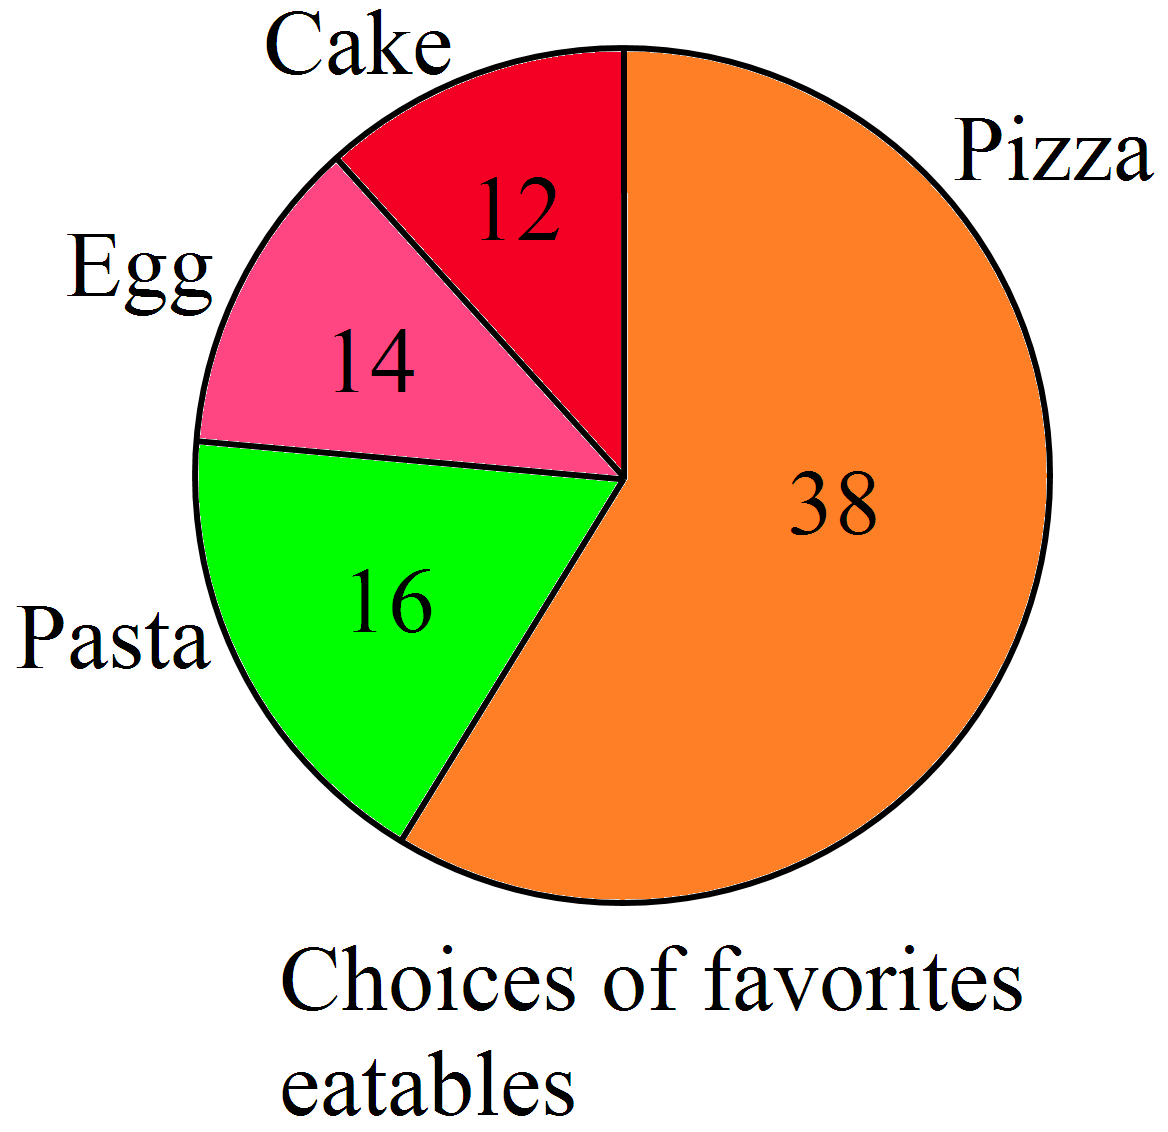
Following pie chart represents the distribution of the different eatables liked by $80$ children. The proportion of the sector for pasta is:
- A
$\frac{1}{7}$th of the circle.
- B
$\frac{1}{3}$rd of the circle.
- C
$\frac{1}{2}$ of the circle.
- ✓
$\frac{1}{5}$th part of the circle.
AnswerCorrect option: D. $\frac{1}{5}$th part of the circle.
Number of children who like pasta $= 38$
Total number of children $= 80$
Proportion of the sector of the pizza $=\frac{\text{Number of children who like pasta}}{\text{Total number of children}}=\frac{16}{80}=\frac{1}{5}$
View full question & answer→MCQ 641 Mark
Study the following frequency distribution table and answer the questions given below:
|
Daily wages
|
Number of works
|
|
$290-325$
|
$5$
|
|
$325-360$
|
$2$
|
|
$360-395$
|
$4$
|
|
$395-430$
|
$6$
|
|
$430-465$
|
$7$
|
|
$465-500$
|
$5$
|
The class with highest frequency is: - ✓
$430-465$
- B
$465-500$
- C
$395-430$
- D
$290-325$
AnswerCorrect option: A. $430-465$
Highest frequency $= 7 \rightarrow 430-465$
View full question & answer→MCQ 651 Mark
A graph showing two sets of data simultaneously is known as:
AnswerA graph showing two sets of data simultaneously is known as double bar graph.
View full question & answer→MCQ 661 Mark
Check the given table, and give the correct answers to the following questions.
|
Range of Marks Obtained
|
Number of students
|
|
$250–300$
|
$10$
|
|
$300–350$
|
$12$
|
|
$350–400$
|
$14$
|
|
$400–450$
|
$13$
|
|
$450–500$
|
$11$
|
When a coin is tossed, what are the possible outcomes? AnswerThe possible outcomes are Head and Tail.
View full question & answer→MCQ 671 Mark
Tick the correct answer in the following:
8 cards are numbered as $1, 2, 3, 4, 5, 6, 7, 8$ respectively. They are kept in a box and mixed thoroughly. One card is chosen at random. What is the probability of getting a number less than $4?$
- A
$\frac{1}{2}$
- B
$\frac{3}{4}$
- ✓
$\frac{3}{8}$
- D
$\frac{3}{5}$
AnswerCorrect option: C. $\frac{3}{8}$
$8$ cards are numbered $1, 2, 3, 4, 5, 6, 7, 8$
They are mixed and kept in a box one care is chosen at random, then probability of card having 9 number less than $4=\frac{3}{8}$
View full question & answer→MCQ 681 Mark
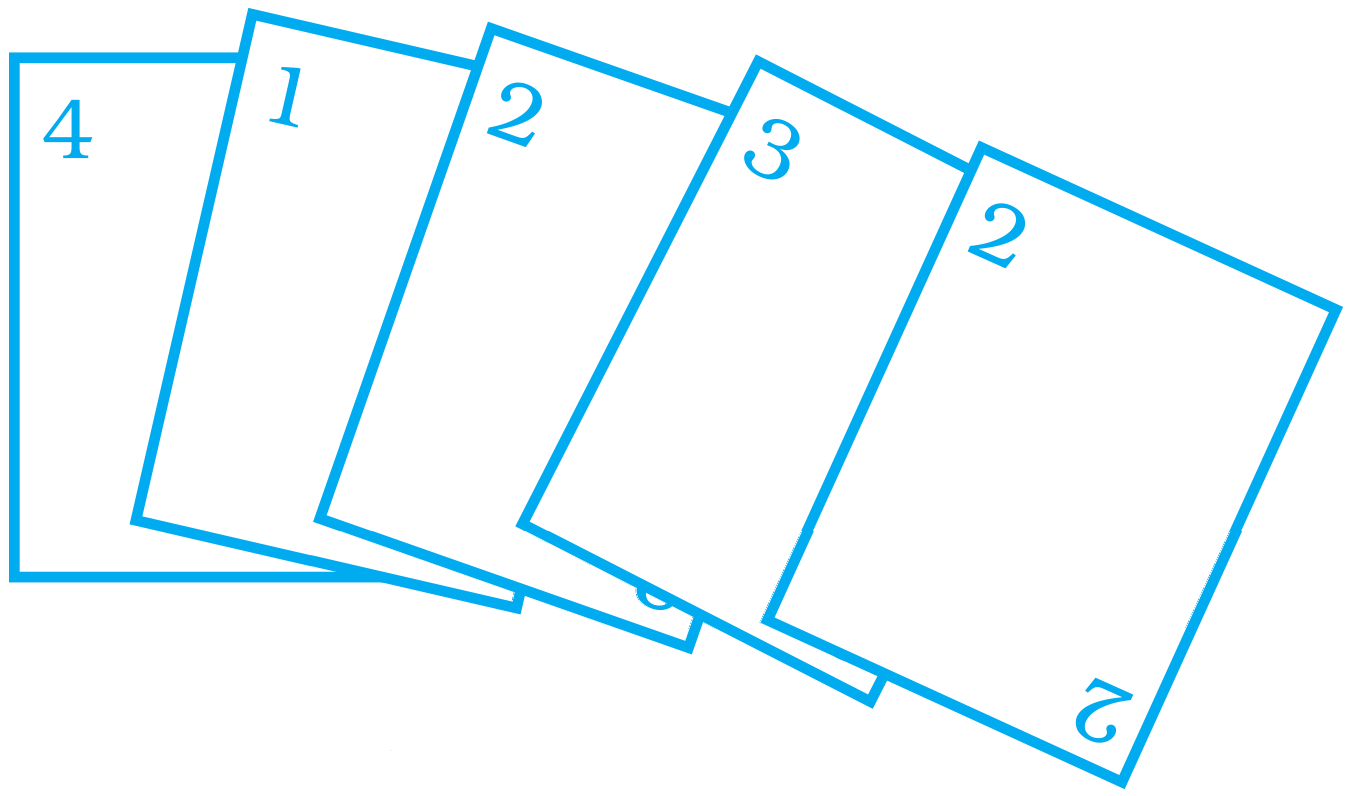
Rohan and Shalu are playing with $5$ cards as shown in the figure. What is the probability of Rohan picking a card without seeing, that has the number $2$ on it?
- ✓
$\frac{2}{5}$
- B
$\frac{1}{5}$
- C
$\frac{3}{5}$
- D
$\frac{4}{5}$
AnswerCorrect option: A. $\frac{2}{5}$
Total number of cards $= 5$
Number of cards having $2$ on it $= 2$
Probability of Rohan picking a card without seeing, that has the number $2$ on it $\frac{2}{5}$
View full question & answer→MCQ 691 Mark
Observe the following bar graph carefully and answer the following questions:

Of which subject are there the maximum books?
AnswerThe height of the bar corresponding to Hindi is maximum.
View full question & answer→MCQ 701 Mark
Study the following frequency distribution table and answer the questions given below:
|
Daily wages
|
Number of works
|
|
$290-325$
|
$5$
|
|
$325-360$
|
$2$
|
|
$360-395$
|
$4$
|
|
$395-430$
|
$6$
|
|
$430-465$
|
$7$
|
|
$465-500$
|
$5$
|
The upper limit of the fourth class is: View full question & answer→MCQ 711 Mark
Check the given table, and give the correct answers to the following questions.
|
Range of Marks Obtained
|
Number of students
|
|
$250–300$
|
$10$
|
|
$300–350$
|
$12$
|
|
$350–400$
|
$14$
|
|
$400–450$
|
$13$
|
|
$450–500$
|
$11$
|
The number of times that a particular entry occurs is called: View full question & answer→MCQ 721 Mark
Study the following frequency distribution table and answer the questions given below:
|
Class interval Age (in years)
|
Number of Persons
|
|
$15-20$
|
$12$
|
|
$20-25$
|
$20$
|
|
$25-30$
|
$42$
|
|
$30-35$
|
$20$
|
|
$35-40$
|
$6$
|
What is the size of the class intervals? View full question & answer→MCQ 731 Mark
The probability of getting number $10$ in a throw of a dice is _______.
AnswerSince the outcome of a throw of dice can never be $10$, the probability is $0.$
View full question & answer→MCQ 741 Mark
A coin is tossed $12$ times and the outcomes are observed as shown below:
The chance of occurrence of Head is: - A
$\frac{1}{2}$
- ✓
$\frac{5}{12}$
- C
$\frac{7}{12}$
- D
$\frac{5}{7}$
AnswerCorrect option: B. $\frac{5}{12}$
Total number of times coin tossed $= 12$
Total number of occurrence of head $= 5$
The chance of occurrence of head $=\frac{\text{Number of times headappeared}}{\text{Number of times a coinis tossed}}$
$=\frac{5}{12}$
View full question & answer→MCQ 751 Mark
Numbers $1$ to $5$ are written on separate slips, i.e one number on one slip and put in a box. Wahida pick a slip from the box without looking at it. What is the probability that the slip bears an odd number?
- A
$\frac{1}{5}$
- B
$\frac{2}{5}$
- ✓
$\frac{3}{5}$
- D
$\frac{4}{5}$
AnswerCorrect option: C. $\frac{3}{5}$
Numbers on the slips are $1, 2, 3, 4$ and $5.$
Odd numbers $= 1, 3, 5$
Number of slips bears an odd number $= 3$
Probability that the slip bears an odd number $=\frac{\text{Number of slipsbearsan odd number}}{\text{Total number of slips}}$
$=\frac{3}{5}$
View full question & answer→MCQ 761 Mark
Observe the histogram and answer the questions given below:

The number of students getting marks $4$ to less than $6$ is: AnswerRequired number
$=$ Frequency of class $(4 - 6) = 4$
View full question & answer→MCQ 771 Mark
What are the possible number of outcomes if a coin is tossed twice?
MCQ 781 Mark
The class mark of $95 - 100$ is:
- A
$95.5$
- ✓
$97.5$
- C
$95$
- D
$100$
AnswerCorrect option: B. $97.5$
$97.5$
View full question & answer→MCQ 791 Mark
If $20-30$ is the class interval of grouped data, then the lower class limit is:
View full question & answer→MCQ 801 Mark
Size of the class $150-175$ is:
AnswerSize of the class $150-175$
= Upper limit - Lower
Limit $= 175 - 150 = 25$
View full question & answer→MCQ 811 Mark
Observe the pie chart and answer the following questions:
Which two colours have the same central angles?
AnswerRed $\rightarrow 45\%$
Yellow $\rightarrow 45\%$
View full question & answer→MCQ 821 Mark
Observe the following bar graph carefully and answer the following questions:

How many books are there of the subject whose books are maximum?
AnswerHindi $\rightarrow 400.$
View full question & answer→MCQ 831 Mark
Tick the correct answer in the following:
A die is thrown. What is the probability of getting an even number?
- ✓
$\frac{1}{2}$
- B
$\frac{2}{3}$
- C
$\frac{5}{6}$
- D
$\frac{1}{6}$
AnswerCorrect option: A. $\frac{1}{2}$
A die is thrown possible outcomes $= 6$
Now probability of getting an even number which are $2, 4, 6 =\frac{3}{6}=\frac{1}{2}$
View full question & answer→MCQ 841 Mark
The shape of a pie$-$chart is:
View full question & answer→MCQ 851 Mark
Observe the following bar graph carefully and answer the following questions:

The total of the number of books of English and Science is:
MCQ 861 Mark
The given graph shows the number of employees who joined the two different companies from january to april how many more employees joined company A than company B from January to april?
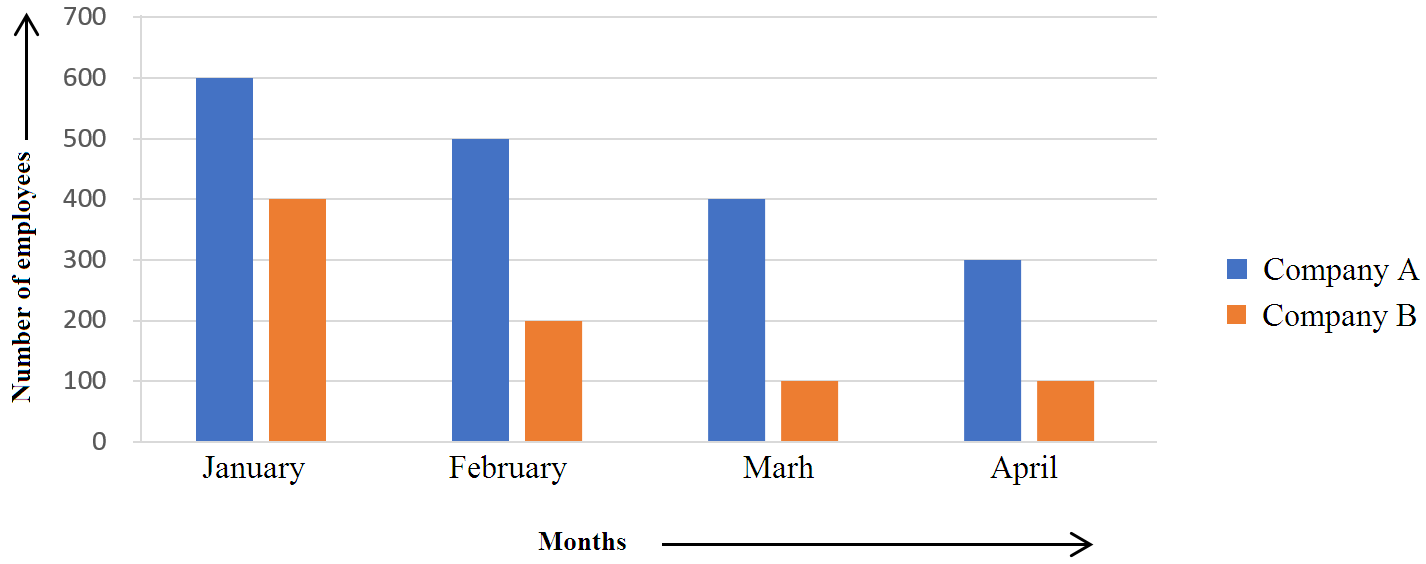
- A
$800$
- ✓
$1000$
- C
$1800$
- D
$1200$
AnswerCorrect option: B. $1000$
Number of employees who joined company $A$ from january to april
$= 600 + 500 + 400 + 300 = 1800$
Number of employees who joined company $B$ from january to april
$= 400 + 200 + 100 + 100 = 800$
In company A there are $1000$ people more than company $B.$
View full question & answer→MCQ 871 Mark
When a coin is thrown, total number of possible outcomes is ______.
MCQ 881 Mark
The difference n the population of $USA$ in the year $1981$ and $1991$ together and in the year $1996$ and $2001$ together is:
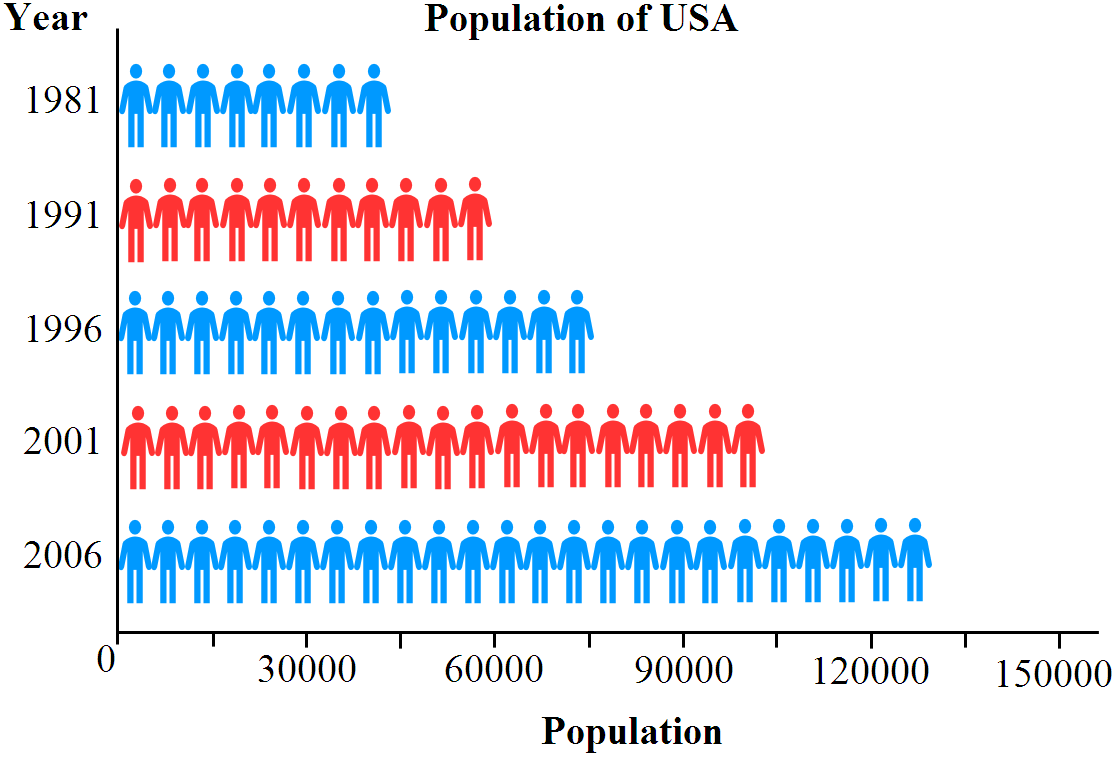
- ✓
$75,000$
- B
$105,000$
- C
$180,000$
- D
$90,000$
AnswerCorrect option: A. $75,000$
Population of $USA$ in the year $1981$ and $1991$ together $= 45,000 + 60,000 = 105,000$
Population of $USA$ in the year $1996$ and $2001$ together $= 75,000 + 105,000 = 180,000$
The difference in the population of $USA$ in the year $1981$ and $1991$ together and in the year $1996$ and $2001$ together$= 180,000 - 105,000 = 75,000$
View full question & answer→MCQ 891 Mark
Study the following frequency distribution table and answer the questions given below:
|
Daily wages
|
Number of works
|
|
$290-325$
|
$5$
|
|
$325-360$
|
$2$
|
|
$360-395$
|
$4$
|
|
$395-430$
|
$6$
|
|
$430-465$
|
$7$
|
|
$465-500$
|
$5$
|
The class with lowest frequency is: - ✓
$325-360$
- B
$360-395$
- C
$465-500$
- D
$395-430$
AnswerCorrect option: A. $325-360$
Lowest frequency $= 2 \rightarrow 325-360$
View full question & answer→MCQ 901 Mark
Numbers $1$ to $10$ are written on ten separates slips (one number on one slip), kept in a box and mixed well. One slip is chosen from the box without looking in to it.
What is the probability of getting a number $6?$
- A
$1$
- B
$0$
- ✓
$\frac{1}{10}$
- D
$\frac{1}{2}$
AnswerCorrect option: C. $\frac{1}{10}$
$\frac{1}{10}$
View full question & answer→MCQ 911 Mark
Which two classes have the same frequency?
|
Class Interval
|
Frequency
|
|
$0 - 10$
|
$1$
|
|
$10 - 20$
|
$6$
|
|
$20 - 30$
|
$20$
|
|
$30 - 40$
|
$12$
|
|
$40 - 50$
|
$6$
|
|
Total
|
$45$
|
- A
$20 – 30$ and 4$0 – 50$
- B
$10 – 20$ and $20 – 30$
- ✓
$10 – 20$ and $40 – 50$
- D
AnswerCorrect option: C. $10 – 20$ and $40 – 50$
$10 – 20$ and $40 – 50$
View full question & answer→MCQ 921 Mark
Adjoining pie chart gives the expenditure $($In percentage$)$ on various items $\&$ savings of a family during a month. Answer the following questions on the basis of the information given in the pie chart.

Expenditure on which item is equal to the total savings of the family? View full question & answer→MCQ 931 Mark
Observe the pie chart given below and answer the following questions:

The central angle for sector $B$ is: - A
$108^\circ$
- ✓
$144^\circ$
- C
$72^\circ$
- D
$120^\circ$
AnswerCorrect option: B. $144^\circ$
Central angle for sector $B$
$=\frac{40}{100}\times 360^\circ = 144^\circ$
View full question & answer→MCQ 941 Mark
Observe the histogram and answer the questions given below:

Which groups contain the maximum number of students?
- A
$2-4$
- B
$4-6$
- C
$6-8$
- ✓
$8-10$
AnswerCorrect option: D. $8-10$
Minimum number of students
$= 2 \rightarrow 8-10$
View full question & answer→MCQ 951 Mark
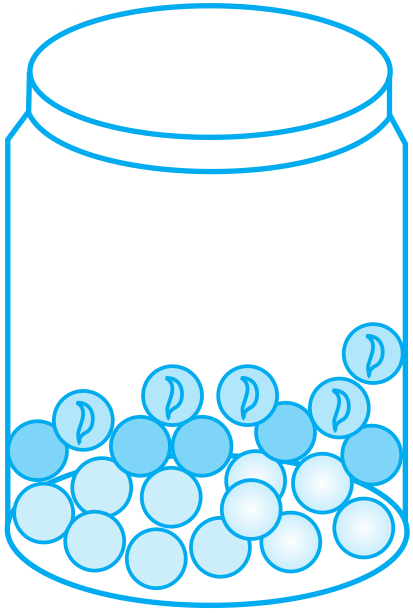
A glass jar contains $6$ red, $5$ green, $4$ blue and $5$ yellow marbles of same size. Hari takes out a marble from the jar at random. What is the probability that the chosen marble is of red colour?
- A
$\frac{7}{10}$
- ✓
$\frac{3}{10}$
- C
$\frac{4}{5}$
- D
$\frac{2}{5}$
AnswerCorrect option: B. $\frac{3}{10}$
As, jar contains $6$ red, $5$ green, $4$ blue and $5$ yellow marbles of same size. Then,
Probability that the chosen marble is of red colour $=\frac{\text{Number of red marbles}}{\text{Total number of marbles}}$
$=\frac{6}{6+5+4+5}$
$=\frac{6}{20}$
$=\frac{3}{10}$
View full question & answer→MCQ 961 Mark
Observe the histogram and answer the questions given below:

Which groups contain the maximum number of students?
- A
$2-4$
- B
$4-6$
- ✓
$6-8$
- D
$8-10$
AnswerMaximum number of students$= 9 \rightarrow 6 – 8$
View full question & answer→MCQ 971 Mark
In the class- interval $70-80, 80$ is the:
View full question & answer→MCQ 981 Mark
Tally marks are used to find which of the following?
AnswerTally marks is used for counting purpose, it is used to find frequency of the data.
View full question & answer→MCQ 991 Mark
Look at the histogram below and find out many students have more than or equal height than $130\ cm$ but less than $145\ cm?$
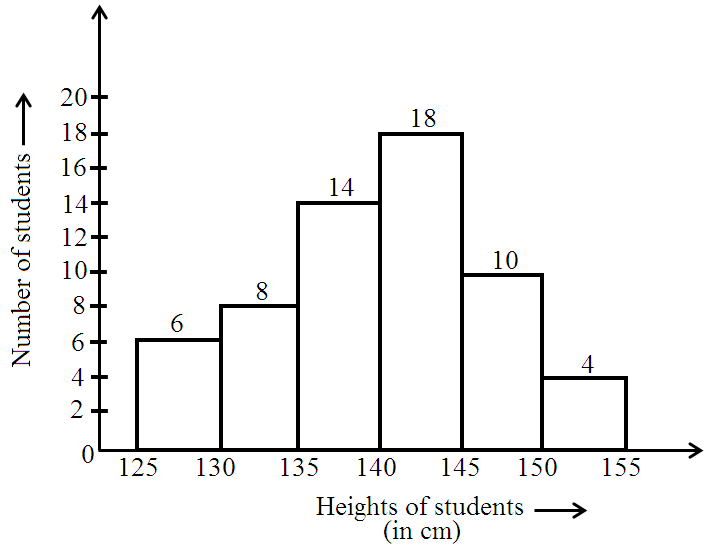
AnswerThe number of student having height more than equal to $130\ cm$ but less than $145\ cm= 8 + 14 + 18 = 40$
View full question & answer→MCQ 1001 Mark
Study the following frequency distribution table and answer the questions given below:
|
Daily wages
|
Number of works
|
|
$290-325$
|
$5$
|
|
$325-360$
|
$2$
|
|
$360-395$
|
$4$
|
|
$395-430$
|
$6$
|
|
$430-465$
|
$7$
|
|
$465-500$
|
$5$
|
The frequency of the third class is: AnswerThird class is $360 – 395$
View full question & answer→MCQ 1011 Mark
Two dice are thrown, find and number of outcomes.
MCQ 1021 Mark
A group of students were asked for their favourite channels on $T.V.$ The result were as listed below:
News, sports, informative, news, entertainment, news, sports, entertainment, informative, news, sports, informative, sports, entertainment, sports, news, entertainment, sports.
Which is the least liked channel?
AnswerArranging the data in the tally marks we get:
|
Channels
|
Tally marks
|
Number of students
|
| News |
$1111$
|
$5$
|
|
Sports
|
$1111 1$
|
$6$ |
| Entertainment |
$1111$
|
$4$
|
| Informative |
$111$
|
$3$
|
The least liked channel is informative channel which is liked by $3$ students. View full question & answer→MCQ 1031 Mark
Observe the histogram and answer the questions given below:

The number of students getting marks $6$ and above is: AnswerRequired number $= 9 + 2 = 11$
View full question & answer→MCQ 1041 Mark
When a die is thrown, total number of possible outcomes is ______.
MCQ 1051 Mark
If a coin is flipped in the air, what is the probability of getting a tail?
- A
$1$
- B
$2$
- ✓
$\frac{1}{2}$
- D
$0$
AnswerCorrect option: C. $\frac{1}{2}$
A coin has two sides, Head and tails.
Probability = Number of possible outcomes/Total number of outcomes
We know that the tail is present on one side of a coin and in total there could be two outcomes $H \& T.$
Hence, the probability of getting a tail $=\frac{1}{2}$
View full question & answer→MCQ 1061 Mark
Observe the histogram and answer the questions given below:

The total number of players making runs $20$ and more is: AnswerRequired number
$= 2 + 16 + 14 + 4 + 6 + 14 + 8 + 10 = 74$
View full question & answer→MCQ 1071 Mark
Check the given table, and give the correct answers to the following questions.
|
Range of Marks Obtained
|
Number of students
|
|
$250–300$
|
$10$
|
|
$300–350$
|
$12$
|
|
$350–400$
|
$14$
|
|
$400–450$
|
$13$
|
|
$450–500$
|
$11$
|
What is the total number of students for all ranges? AnswerTotal number of students $= 10 + 14 + 12 + 13 + 11 = 60$
View full question & answer→MCQ 1081 Mark
Observe the following bar graph carefully and answer the following questions:

The difference of the number of books of English and Science is:
MCQ 1091 Mark
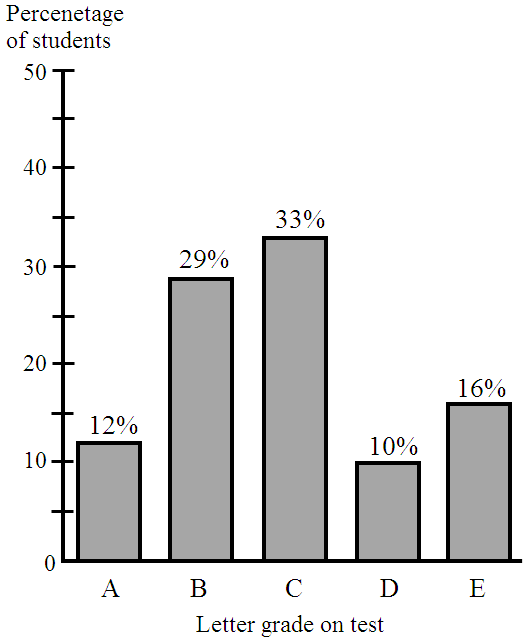
What is the percentage of students who got better than grade $C$ on test?
- A
$52\%$
- ✓
$41\%$
- C
$26\%$
- D
$74\%$
AnswerCorrect option: B. $41\%$
The grades better than grade $'C'$ is grade $'A'$ and $'B'.$
Percentage of students getting grade $'A' = 12\%$
Percentage of students getting grade $'B' = 29\%$
Total percentage of students getting grade better than $'C' = 12\% + 29\% = 41\%$
View full question & answer→MCQ 1101 Mark
Study the following frequency distribution table and answer the questions given below:
|
Daily wages
|
Number of works
|
|
$290-325$
|
$5$
|
|
$325-360$
|
$2$
|
|
$360-395$
|
$4$
|
|
$395-430$
|
$6$
|
|
$430-465$
|
$7$
|
|
$465-500$
|
$5$
|
The total number of workers is: AnswerRequired number $= 5 + 2 + 4 + 6 + 7 + 5$
$= 29$
View full question & answer→MCQ 1111 Mark
A coin is tossed three times. The number of possible outcomes is:
AnswerNumber of possible outcomes is $8,$
i.e. $HHH, HHT, HTH, THH, TTH, THT, HTT, TTT.$
View full question & answer→MCQ 1121 Mark
Find the class width of the following histogram:
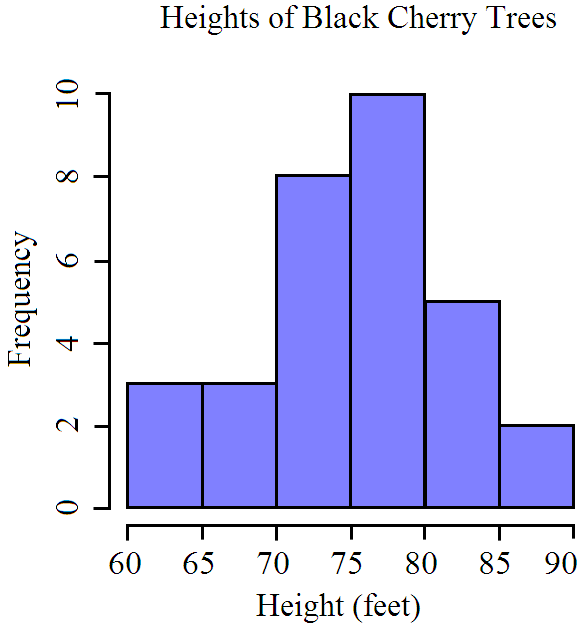
AnswerIntervals are $60 - 65, 65 - 70, 70 - 75, 75 - 80, 80 - 85, 85 - 90$
Class width = Lower class limit - Upper class limit
So the class width $= 65 - 60 = 5$
View full question & answer→MCQ 1131 Mark
Observe the histogram and answer the questions given below:

How many players make runs less than $40?$ AnswerRequired number $= 2 + 16 = 18$
View full question & answer→MCQ 1141 Mark
Check the given table, and give the correct answers to the following questions.
|
Range of Marks Obtained
|
Number of students
|
|
$250–300$
|
$10$
|
|
$300–350$
|
$12$
|
|
$350–400$
|
$14$
|
|
$400–450$
|
$13$
|
|
$450–500$
|
$11$
|
How many students come under the marks range of $300 – 400?$ AnswerNumber of students from $300 - 350 = 12$
Number of students from $350 - 400 = 14$
Thus, the total number of students from $300 - 400 = 12 + 14 = 26$
View full question & answer→MCQ 1151 Mark
Pictorial representation of data using symbols is known as:
MCQ 1161 Mark
What is the total number of buses produced in the months of april, may and june?
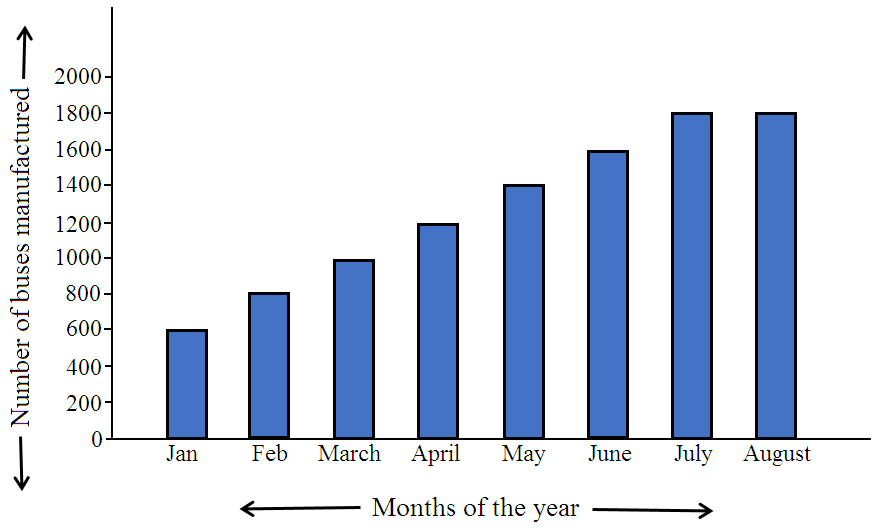
- A
$3200$
- ✓
$4200$
- C
$4100$
- D
$3100$
AnswerCorrect option: B. $4200$
The number of buses produced in april $= 1200$
The number of buses produced in may $= 1400$
The number of buses produced in june $= 1600$
The total number of buses produced over the $3$ years $= 1200 + 1400 + 1600 = 4200$
View full question & answer→MCQ 1171 Mark
A coin is tossed two times. The number of possible outcomes is:
AnswerNumber of possible outcomes is $4,$
i.e. $HH, HT, TH, TT.$
View full question & answer→MCQ 1181 Mark
Ram put some buttons on the table. There were $4$ blue, $7$ red, $3$ black and $6$ white buttons in all. All of a sudden, a cat jumped on the table and knocked out one button on the floor. What is the probability that the button on the floor is blue?
- A
$\frac{7}{20}$
- B
$\frac{3}{5}$
- ✓
$\frac{1}{5}$
- D
$\frac{1}{4}$
AnswerCorrect option: C. $\frac{1}{5}$
Total number of buttons $= 4 + 7 + 3 + 6 = 20$
Probability that button on the floor is blue $=\frac{\text{Number of blue button}}{\text{Total number of button}}$
$=\frac{4}{20}$
$=\frac{1}{5}$
View full question & answer→MCQ 1191 Mark
How much expenditure has been done in all?
- ✓
Rs. $21000$
- B
Rs. $18000$
- C
Rs. $15000$
- D
Rs. $20000$
AnswerCorrect option: A. Rs. $21000$
Total expenditure$= (1 + 6 + 4 + 5 + 2 + 3) \times 1000 = Rs. 21000$
View full question & answer→MCQ 1201 Mark
Study the following frequency distribution table and answer the questions given below:
|
Daily wages
|
Number of works
|
|
$290-325$
|
$5$
|
|
$325-360$
|
$2$
|
|
$360-395$
|
$4$
|
|
$395-430$
|
$6$
|
|
$430-465$
|
$7$
|
|
$465-500$
|
$5$
|
The number of workers getting daily wages $395-430$ (in?) is: AnswerFrequency of class $395 – 430$ is $6$
View full question & answer→MCQ 1211 Mark
When a dice is thrown, list the outcomes of an event of getting composite number.
- A
$\{2, 4, 6\}$
- B
$\{1, 4, 6\}$
- ✓
$\{4, 6\}$
- D
AnswerCorrect option: C. $\{4, 6\}$
The sample space obtained on throwing a dice is: $S = \{1, 2, 3, 4, 5, 6\}$
The composite numbers from the sample space are: Composite $No. = \{4, 6\}$
View full question & answer→MCQ 1221 Mark
Tally marks are used to find:
AnswerTally marks are used to find the frequency of the observations.
View full question & answer→MCQ 1231 Mark
Observe the pie chart given below and answer the following questions:
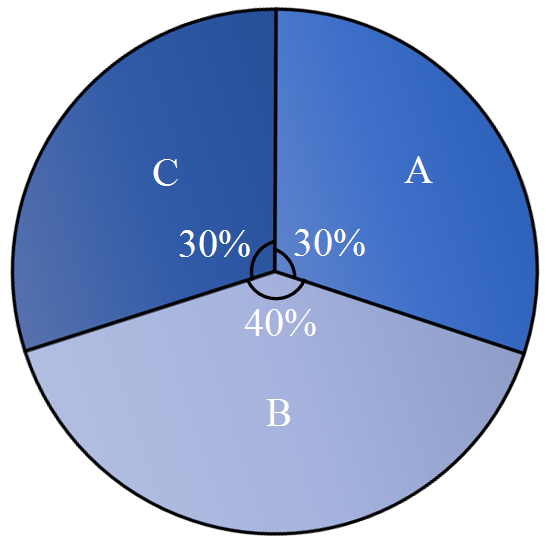
What is the difference between the central angles for sector $B$ and sector $C?$ - ✓
$36^\circ$
- B
$72^\circ$
- C
$9^\circ$
- D
$81^\circ$
AnswerCorrect option: A. $36^\circ$
$144^\circ - 108^\circ = 36^\circ$
View full question & answer→MCQ 1241 Mark
Study the following frequency distribution table and answer the questions given below:
|
Daily wages
|
Number of works
|
| $290-325$ |
$5$ |
| $325-360$ |
$2$ |
| $360-395$ |
$4$ |
| $395-430$ |
$6$ |
| $430-465$ |
$7$ |
| $465-500$ |
$5$ |
The size of the class intervals is: AnswerFourth class is $395-430$
View full question & answer→MCQ 1251 Mark
A dice is thrown. Find the probability of getting number more than $4.$
- ✓
$\frac{1}{3}$
- B
$\frac{2}{3}$
- C
$\frac{3}{6}$
- D
$\frac{4}{6}$
AnswerCorrect option: A. $\frac{1}{3}$
Total outcomes $= 6$
Favourable outcome = Numbers more than $4 = 2$
P (number more than $4) =\frac{\text{favourable outcomes}}{\text{Total outcomes}}$
P (number more than $4) =\frac{2}{6}$
$=\frac{1}{3}$
View full question & answer→MCQ 1261 Mark
Which colour received $\frac{1}{5}$ of the votes?
AnswerBlue $(25\%)$, i.e. $\frac{25}{100}=\frac{1}{4}$ of votes received by blue.
Red $(35\%)$, i.e. $\frac{35}{100}=\frac{7}{20}$ of votes received by red.
Green $(20\%)$, i.e. $\frac{20}{100}=\frac{1}{5}$ of votes received by green.
Yellow $(14\%)$, i.e $\frac{14}{100}=\frac{7}{50}$ of votes received by yellow.
Others $(6\%)$, i.e. $\frac{6}{100}=\frac{3}{50}$ of votes received by others.
Hence, green is the required colour.
View full question & answer→MCQ 1271 Mark
Check the given table, and give the correct answers to the following questions.
|
Range of Marks Obtained
|
Number of students
|
|
$250–300$
|
$10$
|
|
$300–350$
|
$12$
|
|
$350–400$
|
$14$
|
|
$400–450$
|
$13$
|
|
$450–500$
|
$11$
|
How many students secured marks between $250 – 300?$ View full question & answer→MCQ 1281 Mark
Study the following frequency distribution table and answer the questions given below:
|
Daily wages
|
Number of works
|
|
$290-325$
|
$5$
|
|
$325-360$
|
$2$
|
|
$360-395$
|
$4$
|
|
$395-430$
|
$6$
|
|
$430-465$
|
$7$
|
|
$465-500$
|
$5$
|
The number of workers getting wages? 395 and above is: AnswerRequired number $= 6 + 7 + 5 = 18$
View full question & answer→MCQ 1291 Mark
Tick the correct answer in the following:
From a well-shuffled deck of $52$ cards, one card is drawn at random. What is the probability that the drawn card is a queen?
- A
$\frac{1}{4}$
- B
$\frac{1}{52}$
- ✓
$\frac{1}{13}$
- D
$\frac{1}{26}$
AnswerCorrect option: C. $\frac{1}{13}$
one card is drawn from a well shuffled deck of 52 cards, possible out comes $= 52$
The probability of card which is a queen $\frac{4}{52}=\frac{1}{13}$
View full question & answer→MCQ 1301 Mark
A child has a block in the shape of a cube with one letter written on each face as shown below:
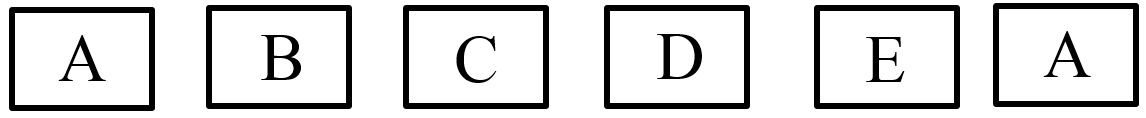
The cube is thrown once. What is the probability of getting A?
- ✓
$\frac{1}{3}$
- B
$\frac{1}{6}$
- C
$\frac{1}{2}$
- D
$\frac{1}{4}$
AnswerCorrect option: A. $\frac{1}{3}$
Probability $\frac{2}{6} = \frac{1}{3}$
View full question & answer→MCQ 1311 Mark
A graph drawn using vertical bars is called.
AnswerBar graph represents the data in the form of vertical bars.
View full question & answer→MCQ 1321 Mark
Total number of outcomes, when a ball is drawn from a bag which contains $3$ red, $5$ black and $4$ blue balls is:
AnswerGiven, a bag contains $3$ red, $5$ black and $4$ blue balls.
Then, total number of outcomes = Total number of balls $= 3 + 5 + 4 = 12$
View full question & answer→MCQ 1331 Mark
The event which cannot happen is called.
AnswerIn probability, event which cannot happen is called impossible event.
For example: Sun rising in the north is an impossible event.
View full question & answer→MCQ 1341 Mark
A bag has $4$ red balls and $4$ green balls, what is the probability of getting a red ball randomly?
- ✓
$\frac{1}{2}$
- B
$\frac{1}{8}$
- C
$\frac{1}{4}$
- D
$0$
AnswerCorrect option: A. $\frac{1}{2}$
Total number of balls in bag $= 4 + 4 = 8$
Total number of red balls $= 4$
Probability of getting a red ball = $\frac{4}{8} = \frac{1}{2}$
View full question & answer→MCQ 1351 Mark
When a die is thrown, list the outcomes of an event of getting : A number greater than $5.$
AnswerFor a die, the possible outcomes are, $1, 2, 3, 4, 5, 6$
From the above outcomes, only $6$ is greater than $5$
So, the possible outcome is $6.$
View full question & answer→MCQ 1361 Mark
Check the given table, and give the correct answers to the following questions.
|
Range of Marks Obtained
|
Number of students
|
|
$250–300$
|
$10$
|
|
$300–350$
|
$12$
|
|
$350–400$
|
$14$
|
|
$400–450$
|
$13$
|
|
$450–500$
|
$11$
|
What is the number of possible outcomes, when two dies are thrown, simultaneously? AnswerNumber of possible outcomes of each dies $= 6$
For two dies, number of possible outcomes $= 6 \times 6 = 36$
View full question & answer→MCQ 1371 Mark
Upper limit of class interval $75-85$ is:
AnswerUpper limit of class interval $75-85$ is $85.$
Note: The upper value of class interval is called its upper class limit and lower value of a class interval is called lower class limit.
View full question & answer→MCQ 1381 Mark
What is the central angle of the sector (in the above pie chart) representing skin and bones together?
- A
$36^\circ$
- B
$60^\circ$
- C
$90^\circ$
- ✓
$96^\circ$
AnswerCorrect option: D. $96^\circ$
The protion representing skin and together $=\frac{1}{10}+\frac{1}{6}$
$=\frac{3+5}{30}$
$=\frac{8}{30}$
Central angle of the sector representing skin and bones together $=\frac{8}{30}\times360^\circ$
$=96^\circ$
View full question & answer→MCQ 1391 Mark
DMonthly salary of a person is $Rs.\ 15000.$ The central angle of the sector representing his expenses on food and house rent on a pie chart is $60^\circ$. The amount he spends on food and house rent is:
- A
$Rs. 5000$
- ✓
$Rs. 2500$
- C
$Rs. 6000$
- D
$Rs. 9000$
AnswerCorrect option: B. $Rs. 2500$
B. $Rs. 2500$
Solution:
Central angle of the sector representing his expenses on food and house rent on a pie chart $= 60^\circ.$
Part of the monthly salary he is expending on food and house rent $=\frac{1}{6}$
Hence, the amount he spends on food and house rent $=\frac{1}{6}\times$ Monthly salary
$\frac{1}{6}\times15000$
$\text{Rs}.2500$
View full question & answer→MCQ 1401 Mark
Study the following frequency distribution table and answer the questions given below:
|
Daily wages
|
Number of works
|
|
$290-325$
|
$5$
|
|
$325-360$
|
$2$
|
|
$360-395$
|
$4$
|
|
$395-430$
|
$6$
|
|
$430-465$
|
$7$
|
|
$465-500$
|
$5$
|
The lower limit of the sixth class is: AnswerSixth class is $465 – 500$
View full question & answer→MCQ 1411 Mark
The height of a rectangle in a histogram shows the:
- A
- B
Upper limit of the class.
- C
Lower limit of the class.
- ✓
AnswerThe height of a rectangle in a histogram shows the frequency of the class,
Note: The number of times a particular observation occurs in a given data, is called its frequency.
View full question & answer→MCQ 1421 Mark
Observe the histogram and answer the questions given below:

Which group contains maximum players?
- A
$20-30$
- ✓
$30-40$
- C
$40-50$
- D
$70-80$
AnswerCorrect option: B. $30-40$
Maximum frequency $= 16 \rightarrow 30-40$
View full question & answer→MCQ 1431 Mark
Tick $(\checkmark)$ the correct answer in the following:
A man's monthly salary is Rs. $2400$ and his monthly expenses on travel are Rs. $250$. The central angle of the sector representing travel expenses in the pie chart would be.
- A
$30^\circ$
- ✓
$37\frac{1}{2}^{\circ}$
- C
$45^\circ$
- D
$60^\circ$
AnswerCorrect option: B. $37\frac{1}{2}^{\circ}$
Central angle of the sector representing travel expenses $=\Big(\frac{\text{value of expenses on travel}}{\text{monthly income}}\times360\Big)^\circ$
$=\Big(\frac{250}{2400}\times360\Big)^{\circ}$
$=37\frac{1}{2}^{\circ}$
View full question & answer→MCQ 1441 Mark
What is the probability of getting a prime number if a die is tossed once?
- A
$\frac{1}{6}$
- B
$\frac{2}{6}$
- ✓
$\frac{3}{6}$
- D
$\frac{4}{6}$
AnswerCorrect option: C. $\frac{3}{6}$
$\frac{3}{6}$
View full question & answer→MCQ 1451 Mark
There are $2$ Red, $3$ Blue and $5$ Black balls in a bag. A ball is drawn from the bag without looking in to the bag. What is the probability of getting a red ball?
- A
$\frac{2}{5}$
- B
$\frac{3}{5}$
- ✓
$\frac{1}{5}$
- D
AnswerCorrect option: C. $\frac{1}{5}$
$\frac{1}{5}$
View full question & answer→MCQ 1461 Mark
If $O$ represents $5$ eggs then how many eggs does $OOOO$ represent?
AnswerGiven, $O$ represents $5$ eggs eggs
$\therefore OOOO$ represents $5 \times 4 = 20$ eggs.
View full question & answer→MCQ 1471 Mark
Which of the following is the probability of a sure event?
AnswerA sure event is the one that is defined to happen for sure.
Getting a head or tail while tossing a coin once is a sure event as the outcome will definitely be either head or tail.
Thus, the probability of a sure event is $1.$
Also, the probability of an impossible event is $0.$
View full question & answer→MCQ 1481 Mark
A coin is tossed. Which of the following is the probability of getting a head or tail?
AnswerCorrect option: C. $\frac{1}{2}$
Total number of possible outcomes $= 2$
i.e., $H$ or $T$
$i.$ If the favourable outcome is head $(H).$
Number of favourable outcomes $= 1.$
Therefore, $P($getting a head$)$
$\text{P(H)} = \frac{\text{Number of favorable outcomes}} {\text{Total number of possible outcomes}}=\frac{1}{2}$
$ii.$ If the favourable outcome is tail $(T).$
Number of favourable outcomes $= 1.$
Therefore, $P($getting a tail$)$
$\text{P(H)} = \frac{\text{Number of favorable outcomes}} {\text{Total number of possible outcomes}}=\frac{1}{2}$
View full question & answer→MCQ 1491 Mark
In a frequency distribution with classes $0-10, 10-20$ etc., the size of the class intervals is $10.$ The lower limit of fourth class is:
AnswerGiven classes are $0-10$ and $10-20.$
As, the class of given classes is $10$, so the next classes will be $20-30$ and $30-40.$
As, the fourth class is $30-40.$
Hence, the lower limit of fourth class is $30.$
View full question & answer→MCQ 1501 Mark
How many students haw got less than $8$ marks?
|
Marks obtained (out of $10)$
|
$4$
|
$5$
|
$7$
|
$8$
|
$10$
|
|
Frequency
|
$6$
|
$9$
|
$8$
|
$5$
|
$2$
|
AnswerThe number of students getting less than $8$ marks $= 6 + 9 + 8 = 23$
View full question & answer→MCQ 1511 Mark
Observe the following bar graph carefully and answer the following questions:

How many books are there of the subject whose books are minimum?
AnswerSocial Science $\rightarrow 100.$
View full question & answer→MCQ 1521 Mark
- A
Rectangles are of equal lengths
- ✓
Width of rectangles is fixed
- C
Rectangles are drawn with unequal shapes between them
- D
Width of rectangles carry important meaning
AnswerCorrect option: B. Width of rectangles is fixed
In a bat chart, width of rectangle is fixed
View full question & answer→MCQ 1531 Mark
A group of students were asked for their favourite animals. The results were as listed below:
Cat, rabbit, cat, rabbit, hamster, cat, dog, cat, dog, dog, hamster, rabbit, dog, hamster, cat, cat, dog, hamster
Which is the most liked animal?
AnswerArranging the data in the tally marks we get:
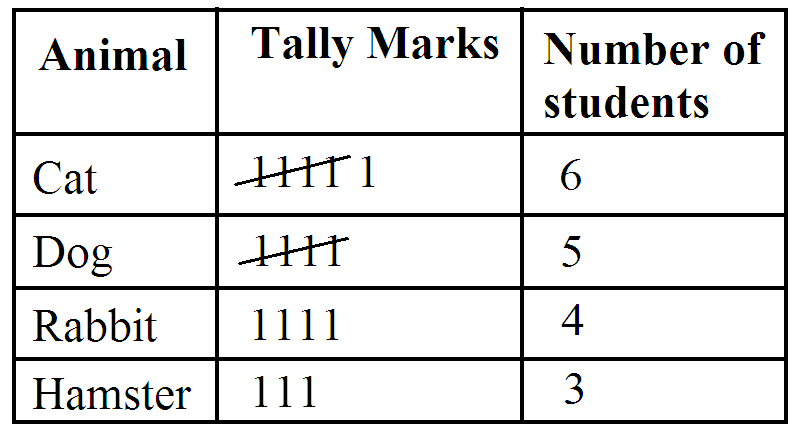
The most liked animal is cat which is liked by $6$ students.
View full question & answer→MCQ 1541 Mark
A symbol is used to represent $10$ flowers. Number of symbols to be drawn to show $60$ flowers is ___________.
AnswerA symbol is used to represent $10$ flowers
Number of symbols to be drawn to represent $60$ flowers $=\frac{60}{10}=6$
View full question & answer→MCQ 1551 Mark
Which type of data can be represented by histogram?
AnswerHistogram represents grouped data.
View full question & answer→MCQ 1561 Mark
Tick the correct answer in the following:
From a well-shuffled deck of $52$ cards, one card is drawn at random. What is the probability that the drawn card is a black $6?$
- A
$\frac{3}{26}$
- ✓
$\frac{1}{26}$
- C
$\frac{1}{13}$
- D
$\frac{1}{52}$
AnswerCorrect option: B. $\frac{1}{26}$
One card is drawn from a well-shuffled deck of $52$ card, possible out comes $= 52$ probability of a card being a black $6$
(Which are two) $=\frac{2}{52}=\frac{1}{26}$
View full question & answer→MCQ 1571 Mark
The width or size of the class interval $30-40$ is:
AnswerWidth of class interval = upper class limit-lower class limit$= 40 - 30$
$= 10$
View full question & answer→MCQ 1581 Mark
Adjoining pie chart gives the expenditure $($In percentage$)$ on various items $\&$ savings of a family during a month. Answer the following questions on the basis of the information given in the pie chart.

On which item, the expenditure is maximum?MCQ 1591 Mark
Observe the histogram and answer the questions given below:

Which group has minimum players?
- ✓
$20-30$
- B
$50-60$
- C
$60-70$
- D
$30-40$
AnswerCorrect option: A. $20-30$
Minimum frequency $= 2 \rightarrow 20-30$
View full question & answer→MCQ 1601 Mark
Observe the pie chart and answer the following questions:

The proportion of sector for red is:
- A
$\frac{1}{2}$
- B
$\frac{1}{4}$
- ✓
$\frac{1}{8}$
- D
$\frac{1}{3}$
AnswerCorrect option: C. $\frac{1}{8}$
$\frac{45^\circ}{360^\circ}=\frac{1}{8}$
View full question & answer→MCQ 1611 Mark
Study the following frequency distribution table and answer the questions given below:
|
Class interval Age (in years)
|
Number of Persons
|
|
$15-20$
|
$12$
|
|
$20-25$
|
$20$
|
|
$25-30$
|
$42$
|
|
$30-35$
|
$20$
|
|
$35-40$
|
$6$
|
Which two classes have the same frequency? - A
$15-20$ and $35-40$
- ✓
$20-25$ and $30-35$
- C
$15-20$ and $30-35$
- D
$20-25$ and $25-30$
AnswerCorrect option: B. $20-25$ and $30-35$
Frequency of class $20-25 =$ Frequency of class $30-35 = 20$
View full question & answer→MCQ 1621 Mark
Tick $(\checkmark)$ the correct answer in the following:
If $35\%$ of the people residing in a locality are Sikhs then the central angle of the sector representing the Sikh community in the pie chart would be.
- A
$108^\circ$
- B
$115^\circ$
- ✓
$126^\circ$
- D
$135^\circ$
AnswerCorrect option: C. $126^\circ$
Central angle of the sector representing the sikh community $=\Big(\frac{\text{value(in%)of each community}}{\text{100}}\times360\Big)^\circ$
$=\Big(\frac{35}{100}\times360\Big)^{\circ}$
$=126^\circ$
View full question & answer→MCQ 1631 Mark
Data collected in a survey shows that $40\%$ of the buyers are interested in buying a particular brand of toothpaste. The central angle of the sector of the pie chart representing this information is:
- A
$120^\circ$
- B
$150^\circ$
- ✓
$144^\circ$
- D
$40^\circ$
AnswerCorrect option: C. $144^\circ$
Percentage of buyers who selected the particular brand of toothpaste $= 40\ \%$
Central angle of the sector of pie chart representing the above information $= 40\ \%$ of central angle
$=\frac{40}{100}\times360^\circ$
$=144^\circ$
View full question & answer→MCQ 1641 Mark
Tick the correct answer in the following:
A die is thrown. What is the probability of getting $6?$
- A
$1$
- ✓
$\frac{1}{6}$
- C
$\frac{6}{1}$
- D
AnswerCorrect option: B. $\frac{1}{6}$
A die is thrown then possible outcomes $= 6$
Now probability of getting $6$ is $\frac{1}{6}$
View full question & answer→MCQ 1651 Mark
What are the possible number of outcomes if a die is tossed once?
MCQ 1661 Mark
On which item has the minimum expenditure been done?
AnswerThe height of the bar corresponding to servant’s salary is minimum.
View full question & answer→MCQ 1671 Mark
A die is thrown. what is the probability of getting an even prime number?
- ✓
$\frac{1}{6}$
- B
$\frac{1}{4}$
- C
$\frac{1}{3}$
- D
$\frac{1}{2}$
AnswerCorrect option: A. $\frac{1}{6}$
Even prime number$ = 2$
$\therefore$ Probability = $\frac{1}{6}$
View full question & answer→MCQ 1681 Mark
There are $2$ Red, $3$ Blue and $5$ Black balls in a bag. A ball is drawn from the bag without looking in to the bag. What is the probability of getting a non-black ball?
- A
$\frac{3}{5}$
- B
$\frac{2}{5}$
- ✓
$\frac{1}{2}$
- D
AnswerCorrect option: C. $\frac{1}{2}$
$\frac{1}{2}$
View full question & answer→MCQ 1691 Mark
The pie chart shows $2400$ people using different mode to travel to office. The numbers of people going to office by walking are:
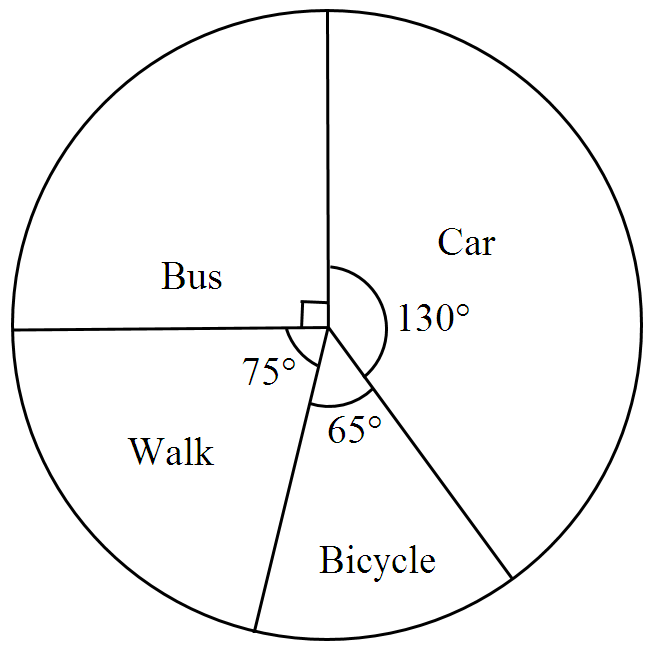
- ✓
$500$
- B
$550$
- C
$1850$
- D
$1800$
AnswerThe total number of people $= 2400$
So, number of people going to office by walking = $\frac{75}{360}\times2400 = 500$
View full question & answer→MCQ 1701 Mark
Check the given table, and give the correct answers to the following questions..
|
Range of Marks Obtained
|
Number of students
|
|
$250–300$
|
$10$
|
|
$300–350$
|
$12$
|
|
$350–400$
|
$14$
|
|
$400–450$
|
$13$
|
|
$450–500$
|
$11$
|
A die is thrown. What is the probability of getting even prime number? - A
$\frac{1}{5}$
- B
$\frac{1}{3}$
- ✓
$\frac{1}{6}$
- D
$\frac{1}{2}$
AnswerCorrect option: C. $\frac{1}{6}$
When a die is thrown,
Number of total possible outcomes $= 6$
Number of even prime numbers $= 1 (2$ is the only even prime number)
Thus, the probability of getting a even prime number,
$\text{P} = \frac{1}{6}$
View full question & answer→MCQ 1711 Mark
In a pie chart, the total angle at the centre of the circle is:
- A
$180^\circ$
- ✓
$360^\circ$
- C
$270^\circ$
- D
$90^\circ$
AnswerCorrect option: B. $360^\circ$
B. $360^\circ$
Solution:
The total angle at the centre of the circle is $360^\circ.$
View full question & answer→MCQ 1721 Mark
If a die is thrown in the air, the probability of getting even numbers is:
- A
$\frac{1}{3}$
- B
$\frac{1}{6}$
- C
$\frac{2}{3}$
- ✓
$\frac{1}{2}$
AnswerCorrect option: D. $\frac{1}{2}$
A die has six sides each consisting numbers from $1$ to $6$, i.e. $\{1, 2, 3, 4, 5, 6\}.$
Total possible outcomes $= 6$
Number of even numbers on a die $= 3$
i.e. $\{2, 4, 6\}$
Probability $=\frac{3}{6}=\frac{1}{2}$
View full question & answer→MCQ 1731 Mark
Listed below are the temperature in ${}^\circ C$ for $10$ days.
$-6, -8, 0, 3, 2, 0, 1, 5, 4, 4$
What is the range of the data?
- A
$8$
- ✓
$13{}^\circ C$
- C
$10{}^\circ C$
- D
$12{}^\circ C$
AnswerCorrect option: B. $13{}^\circ C$
B. $13{}^\circ C$
Solution:
Range of data = Maximum temperature - Minimum temperature $= 5 - (-8) = 5 + 8 =13$
Hence, the range of data is $13{}^\circ C.$
View full question & answer→MCQ 1741 Mark
Which of the following is an experiment?
AnswerAll the given options are an experiment as the result is not predictable and is from the possible list of its outcomes. Hence all satisfy the condition of being an experiment.
View full question & answer→MCQ 1751 Mark
$..........$ gives the number of times a particular entry occurs.
- A
- ✓
Frequency distribution table.
- C
- D
AnswerCorrect option: B. Frequency distribution table.
Frequency distribution table.
View full question & answer→MCQ 1761 Mark
Study the following frequency distribution table and answer the questions given below:
|
Class interval Age (in years)
|
Number of Persons
|
|
$15-20$
|
$12$
|
|
$20-25$
|
$20$
|
|
$25-30$
|
$42$
|
|
$30-35$
|
$20$
|
|
$35-40$
|
$6$
|
Which class has the lowest frequency? - ✓
$35-40$
- B
$30-35$
- C
$15-20$
- D
$25-30$
AnswerCorrect option: A. $35-40$
Lowest frequency $= 6 \rightarrow 35 – 40.$
View full question & answer→MCQ 1771 Mark
What is the expenditure done on food?
- A
Rs. $1000$
- B
Rs. $2000$
- C
Rs. $3000$
- ✓
Rs. $5000$
AnswerCorrect option: D. Rs. $5000$
Expenditure done on food $= 5 \times 1000$
$= Rs. 5000$
View full question & answer→MCQ 1781 Mark
Histogram are a great way to show results of _________.
AnswerWe know, histogram is a graphical representation of data using bars with no gap in between, i.e. it shows continuous data.
Also, the height of the bar shows the frequency of the class-interval.
Hence, option $B$ is correct.
View full question & answer→MCQ 1791 Mark
Observe the following bar graph carefully and answer the following questions:
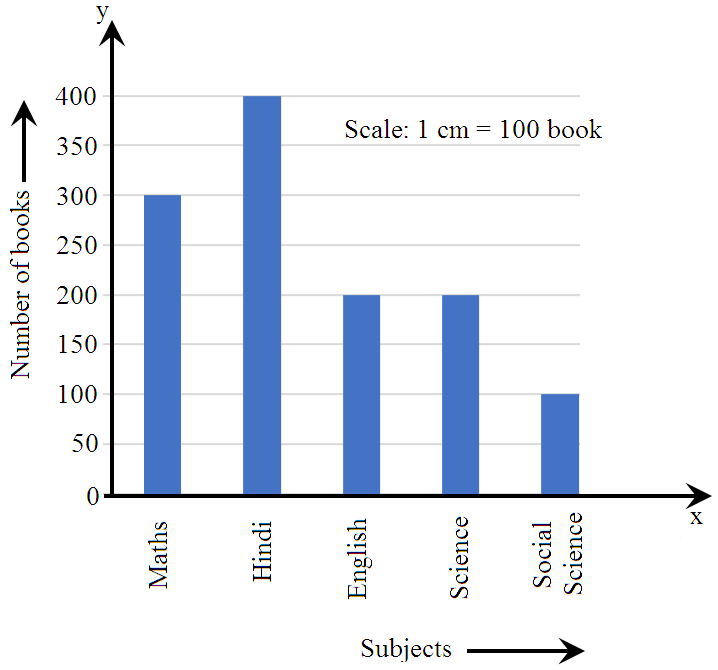
$300$ books are of the subject: Answer$300 \rightarrow $ Maths.
View full question & answer→MCQ 1801 Mark
The pie$-$chart is divided into:
View full question & answer→MCQ 1811 Mark
In the interval $35 - 45, 45$ is called:
AnswerThe upper value of specific class interval is called the Upper limit of that class. And, the lower value of specific class interval is called the Lower limit of that class. Thus, the Upper Limit of Class Interval $35 – 45$ is $45.$
View full question & answer→MCQ 1821 Mark
The class mark of the class $20-30$ is:
AnswerClass mark $= \frac{\text{Upper limit+ Lower limit}}{2}$
$\therefore $ Class mark of the class 20-30 $= \frac{30+ 20}{2}= \frac{50}{2}=25$
View full question & answer→MCQ 1831 Mark
Tick the correct answer in the following:
A bag contains $3$ white and $2$ red balls. One ball is drawn at random. What is the probability that the ball drawn is red?
- A
$\frac{1}{2}$
- B
$\frac{2}{3}$
- C
$\frac{1}{5}$
- ✓
$\frac{2}{5}$
AnswerCorrect option: D. $\frac{2}{5}$
In a bag, there are $3$ white and $2$ red balls possible outcomes $= 3 + 2 = 5$
Now probability of a red ball drawn$=\frac{2}{5}$
View full question & answer→MCQ 1841 Mark
Observe the pie chart given below and answer the following questions:

Which sector has the greatest angle?
AnswerGreatest percentage $= 40\% \rightarrow B$
View full question & answer→MCQ 1851 Mark
In the grouped data, each of the group is called:
- A
- B
Grouped frequency distribution.
- C
- ✓
View full question & answer→MCQ 1861 Mark
The central total angle in a pie chart is:
- A
$180^\circ$
- B
$210^\circ$
- ✓
$360^\circ$
- D
AnswerCorrect option: C. $360^\circ$
$360^\circ$
View full question & answer→MCQ 1871 Mark
The range of the data $30, 61, 55, 56, 60, 20, 26, 46, 28, 56$ is:
AnswerRange of data = Maximum value - Minimum value $= 61 - 20 = 41$
View full question & answer→MCQ 1881 Mark
The difference between the upper and lower limit is called.
MCQ 1891 Mark
Study the following frequency distribution table and answer the questions given below:
|
Daily wages
|
Number of works
|
|
$290-325$
|
$5$
|
|
$325-360$
|
$2$
|
|
$360-395$
|
$4$
|
|
$395-430$
|
$6$
|
|
$430-465$
|
$7$
|
|
$465-500$
|
$5$
|
The number of workers getting wages below? $360$ is: AnswerRequired number $= 5 + 2 = 7$
View full question & answer→MCQ 1901 Mark
On which item has the maximum expenditure been done?
AnswerThe height of the bar corresponding to conveyance is the maximum.
View full question & answer→MCQ 1911 Mark
Is history which of the following is represented by the heights of the rectangles?
AnswerA histogram is a display of statistical information that uses rectangles to show the frequency of data items in successive numerical intervals of equal size.
Hence, height of the rectangle represents the frequency of the class.
View full question & answer→MCQ 1921 Mark
In a throw of a dice, the probability of getting the number $7$ is:
- A
$\frac{1}{2}$
- B
$\frac{1}{6}$
- C
$1$
- ✓
$0$
AnswerIn a die, there are only $6$ numbers, which are $1,2,3,4,5$ and $6$ .
Hence, there is no possibility of number $7$ .
Therefore, probability of getting the number $7$ is $0$ .
View full question & answer→MCQ 1931 Mark
There are $2$ Red, $3$ Blue and $5$ Black balls in a bag. A ball is drawn from the bag without looking in to the bag. What is the probability of getting a non$-$blue ball?
- ✓
$\frac{7}{10}$
- B
$\frac{3}{5}$
- C
$\frac{2}{5}$
- D
AnswerCorrect option: A. $\frac{7}{10}$
$\frac{7}{10}$
View full question & answer→MCQ 1941 Mark
What is the size of the class interval?
|
Class Interval
|
Frequency
|
|
$0 - 10$
|
$1$
|
|
$10 - 20$
|
$6$
|
|
$20 - 30$
|
$20$
|
|
$30 - 40$
|
$12$
|
|
$40 - 50$
|
$6$
|
|
Total
|
$45$
|
View full question & answer→MCQ 1951 Mark
Study the following frequency distribution table and answer the questions given below:
|
Class interval Age (in years)
|
Number of Persons
|
|
$15-20$
|
$12$
|
|
$20-25$
|
$20$
|
|
$25-30$
|
$42$
|
|
$30-35$
|
$20$
|
|
$35-40$
|
$6$
|
What is the upper limit of the class interval $25-30?$ View full question & answer→MCQ 1961 Mark
Adjoining pie chart gives the expenditure (In percentage) on various items & savings of a family during a month. Answer the following questions on the basis of the information given in the pie chart.
If the monthly savings of the family is Rs. $3000$, what is the monthly expenditure on clothes? - ✓
Rs. $2000$
- B
Rs. $3000$
- C
Rs. $1000$
- D
Rs. $4000$
AnswerCorrect option: A. Rs. $2000$
Rs. $2000$
View full question & answer→MCQ 1971 Mark
Tick $(\checkmark)$ the correct answer in the following:
In the pie chart representing the percentages of students having interest in reading various kinds of books, the central angle of the sector representing students reading novels is $81^\circ $. What is the percentage of students interested in reading novels?
- A
$15\%$
- B
$18\%$
- ✓
$22\frac{1}{2}\%$
- D
$27\frac{1}{2}\%$
AnswerCorrect option: C. $22\frac{1}{2}\%$
Let the required percentage be $x$. Then we have:
$\Big(\frac{\text{x}}{100}\times360\Big)=81$
$\Rightarrow\frac{\text{360x}}{100}\times81$
$\Rightarrow\text{x}=\Big(81\times\frac{\text{100}}{360}\Big)$
$\Rightarrow\text{x}=\frac{45}{2}$
$\Rightarrow\text{x}=22\frac{1}{2}$
Hence, the percentage of students who are interested in reading novels is $22\frac{1}{2}\%$.
View full question & answer→MCQ 1981 Mark
The experiment whose outcomes cannot be predicted in advance is $...............$
AnswerRandom experiment is the experiment whose outcomes can't be predicted.
View full question & answer→MCQ 1991 Mark
There are $2$ Red, $3$ Blue and $5$ Black balls in a bag. A ball is drawn from the bag without looking in to the bag. What is the probability of getting a non-red ball?
- A
$\frac{3}{5}$
- ✓
$\frac{4}{5}$
- C
$\frac{2}{5}$
- D
AnswerCorrect option: B. $\frac{4}{5}$
$\frac{4}{5}$
View full question & answer→MCQ 2001 Mark
Which of the following is not a random experiment?
AnswerCorrect option: D. Thowing a stone from a roof of a building.
Tossing a coin, rolling a die and choosing a card from a deck of $52$ cards are the random experiments, as we don’t have an idea about the output of these experiments. But if we throw a stone from the roof of a building, we know the output, it will fail on the ground.
View full question & answer→MCQ 2011 Mark
What is the probability of getting a king if a card is drawn from a pack of $52$ cards?
- A
$\frac{1}{52}$
- B
$\frac{2}{52}$
- C
$\frac{3}{52}$
- ✓
$\frac{4}{52}$
AnswerCorrect option: D. $\frac{4}{52}$
$\frac{4}{52}$
View full question & answer→MCQ 2021 Mark
What is the probability of choosing a vowel from the alphabets?
- A
$\frac{21}{26}$
- ✓
$\frac{5}{26}$
- C
$\frac{1}{26}$
- D
$\frac{3}{26}$
AnswerCorrect option: B. $\frac{5}{26}$
Total number of alphabets $= 26$
Total number of vowels $= 5$
Probability of choosing a vowel from the alphabets $=\frac{\text{Total number of vowels}}{\text{Total number of alphabets}}$
$=\frac{5}{26}$
View full question & answer→MCQ 2031 Mark
Observe the pie chart given below and answer the following questions:

The central angle for sector $A$ is: - ✓
$108^\circ$
- B
$144^\circ$
- C
$72^\circ$
- D
$150^\circ$
AnswerCorrect option: A. $108^\circ$
Central angle for sector $A$
$=\frac{30}{100}\times 360^\circ = 108^\circ$
View full question & answer→