Question 11 Mark
The class size of the interval $80-85$ is _____.
AnswerThe class size of the interval $80-85$ is $5.$
Solution:
Class size of the interval $80-85 =$ Upper class limit $-$ Lower class limit $= 85 - 80 = 5$
View full question & answer→Question 21 Mark
The frequency of more than $8$ marks is $21.$
AnswerThe frequency of more than $8$ marks $= 12 + 9 = 21$
View full question & answer→Question 31 Mark
The probability of getting number 6 in a throw of a dice is $\frac{1}{6}.$ Similarly the probability of getting a number $5$ is $\frac{1}{5}.$
AnswerFalse. Solution: The probability of getting number $6$ or number $5$ on a throw of a die $=\frac{1}{6}.$
View full question & answer→Question 41 Mark
In a pie chart two central angles can be of $180^\circ$.
AnswerTrue.
Solution:
In a pie chart two central angles can be of $180^\circ$.
View full question & answer→Question 51 Mark
The total number of people surveyed is _____.
AnswerThe total number of people surveyed is $35.$
Solution:
Total number of people surveyed $= 8 + 14 + -5 + 6 + 2 = 35$
View full question & answer→Question 61 Mark
Data available in an unorganised form is called _____ data.
AnswerData available in an unorganised form is called raw data.
View full question & answer→Question 71 Mark
The sixth class interval for a grouped data whose first two class intervals are $10-15$ and $15-20$ is _____.
AnswerThe sixth class interval for a grouped data whose first two class intervals are $10-15$ and $15-20$ is $35-40.$
Solution:
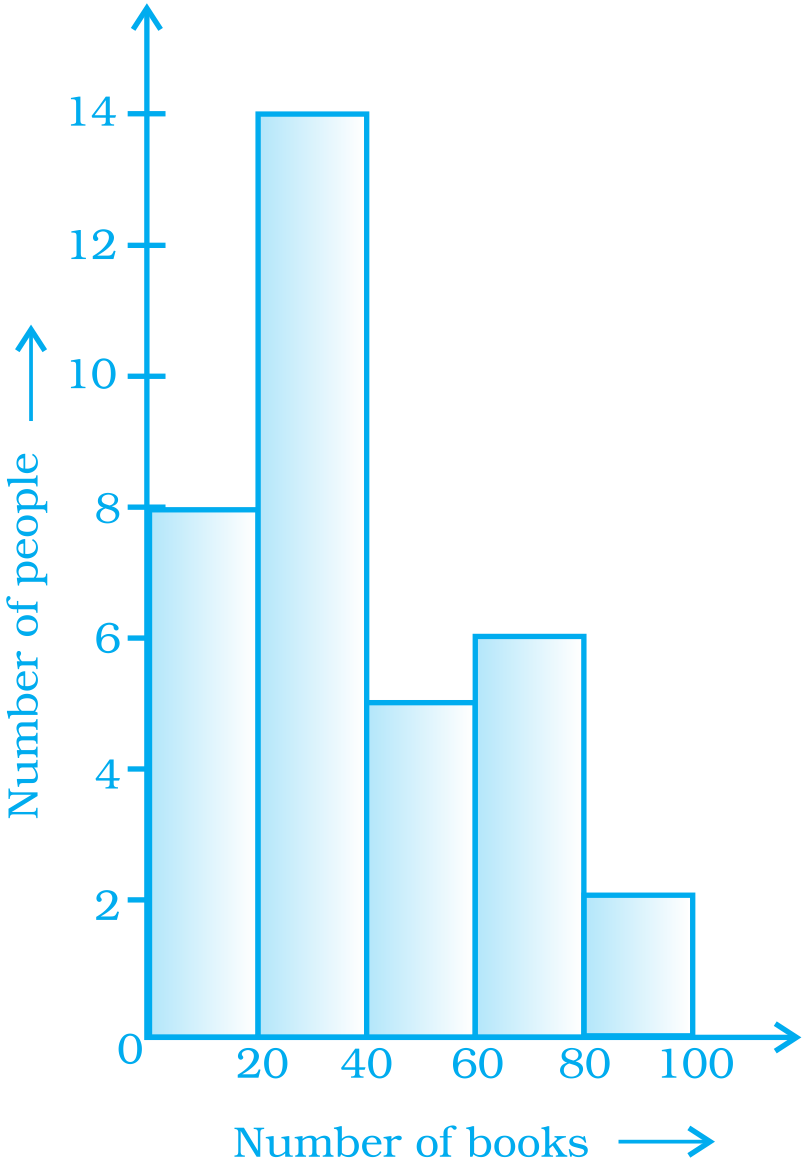
Histogram given below shows the number of people owning the different number of books. Answer $47$ to $50$ based on it. View full question & answer→Question 81 Mark
The number of times a particular observation occurs in a given data is called its _____.
AnswerThe number of times a particular observation occurs in a given data is called its frequency.
View full question & answer→Question 91 Mark
The number of people having books more than $20$ and less than $40$ is _____.
AnswerThe number of people having books more than $20$ but less than $40 = 14$
View full question & answer→Question 101 Mark
When a dice is rolled, the six possible outcomes are _____.
AnswerWhen a dice is rolled, the six possible outcomes are $1, 2, 3, 4, 5, 6.$
View full question & answer→Question 111 Mark
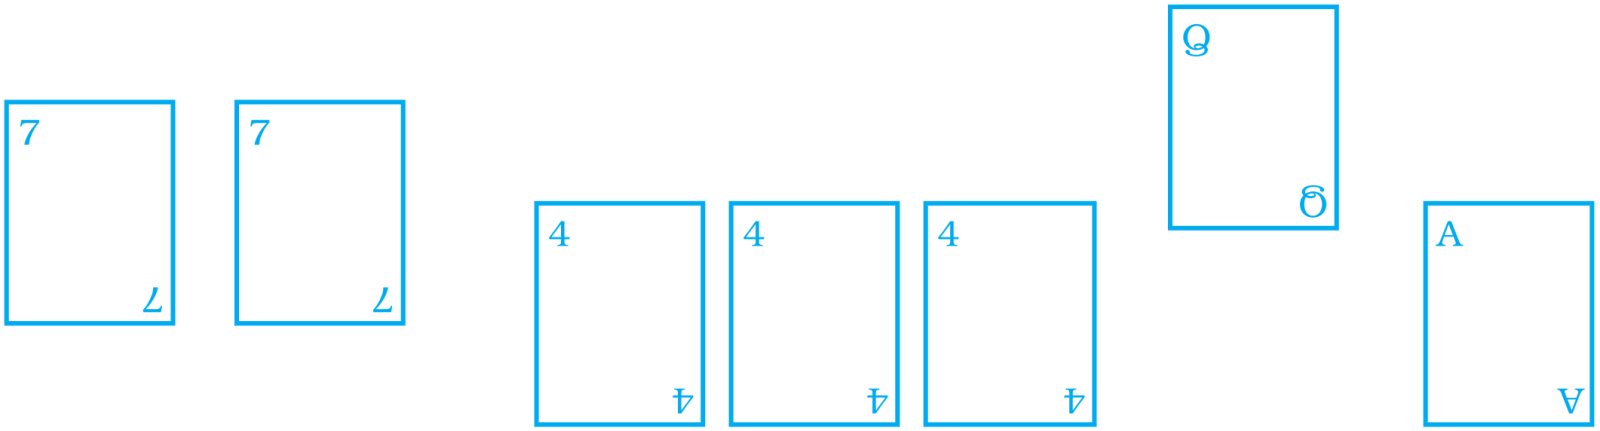
Playing cards: Now the following cards are added to the above cards:
What is the probability of Suhail winning now$?$ Reshma wins if she picks up a $4.$ What is the probability of Reshma winning? $[$Queen, King and Jack cards are called face cards.$]$ Answer$P($Suhail winning now$)$
$=\frac{4}{15}[ $as there is only one face card$]$
$P($Reshma winning$)$
$=\frac{4}{15} [$as there are four $4$-number cards$]$
View full question & answer→Question 121 Mark
$10$ marks the highest frequency.
Answer$9$ Marks has the highest frequency.
View full question & answer→Question 131 Mark
In the class interval $20-30,$ the lower class limit is _____.
AnswerIn the class interval $20-30,$ the lower class limit is $20.$
View full question & answer→Question 141 Mark
In a throw of a dice, the probability of getting an even number is the same as that of getting an odd number.
AnswerIn throw of a die, the occurrence of even numbers can be as $2, 4, 6$ and the occurrence of odd numbers can be as $1, 3, 5.$ Hence, probability of getting an even number is same as that of getting an odd number on a throw of a die.
View full question & answer→Question 151 Mark
The frequency of less than $8$ marks is $29.$
AnswerThe frequency of less than $8$ marks $= 5 + 10 + 8 = 23$
View full question & answer→Question 161 Mark
In the class interval $26-33, 33$ is known as _____.
AnswerIn the class interval $26-33, 33$ is known as upper class limit.
View full question & answer→Question 171 Mark
$9$ students got full marks.
Answer$9$ students got full marks.
View full question & answer→Question 181 Mark
In the experiment of tossing a coin one time, the outcome is either _____ or _____.
AnswerIn the experiment of tossing a coin one time, the outcome is either head or tail.
View full question & answer→Question 191 Mark
The total number of outcomes when a coin is tossed is _____.
AnswerThe total number of outcomes when a coin is tossed is $2.$
Solution:
i.e. head or tail.
View full question & answer→Question 201 Mark
An experiment whose outcomes cannot be predicted exactly in advance is called a _____ experiment.
Answer An experiment whose outcomes cannot be predicted exactly in advance is called a random experiment.
View full question & answer→Question 211 Mark
In a histogram, class intervals and frequencies are taken along _____ axis and _____ axis.
AnswerIn a histogram, class intervals and frequencies are taken along $X$ axis and $Y$ axis.
View full question & answer→Question 221 Mark
The number of people owning books more than $60$ is _____.
AnswerThe number of people owning books more than $60$ is $8.$
Solution:
The number of people owning books more than $60 = 6 + 2 = 8$
View full question & answer→Question 231 Mark
The following pictorial representation of data is a histogram. 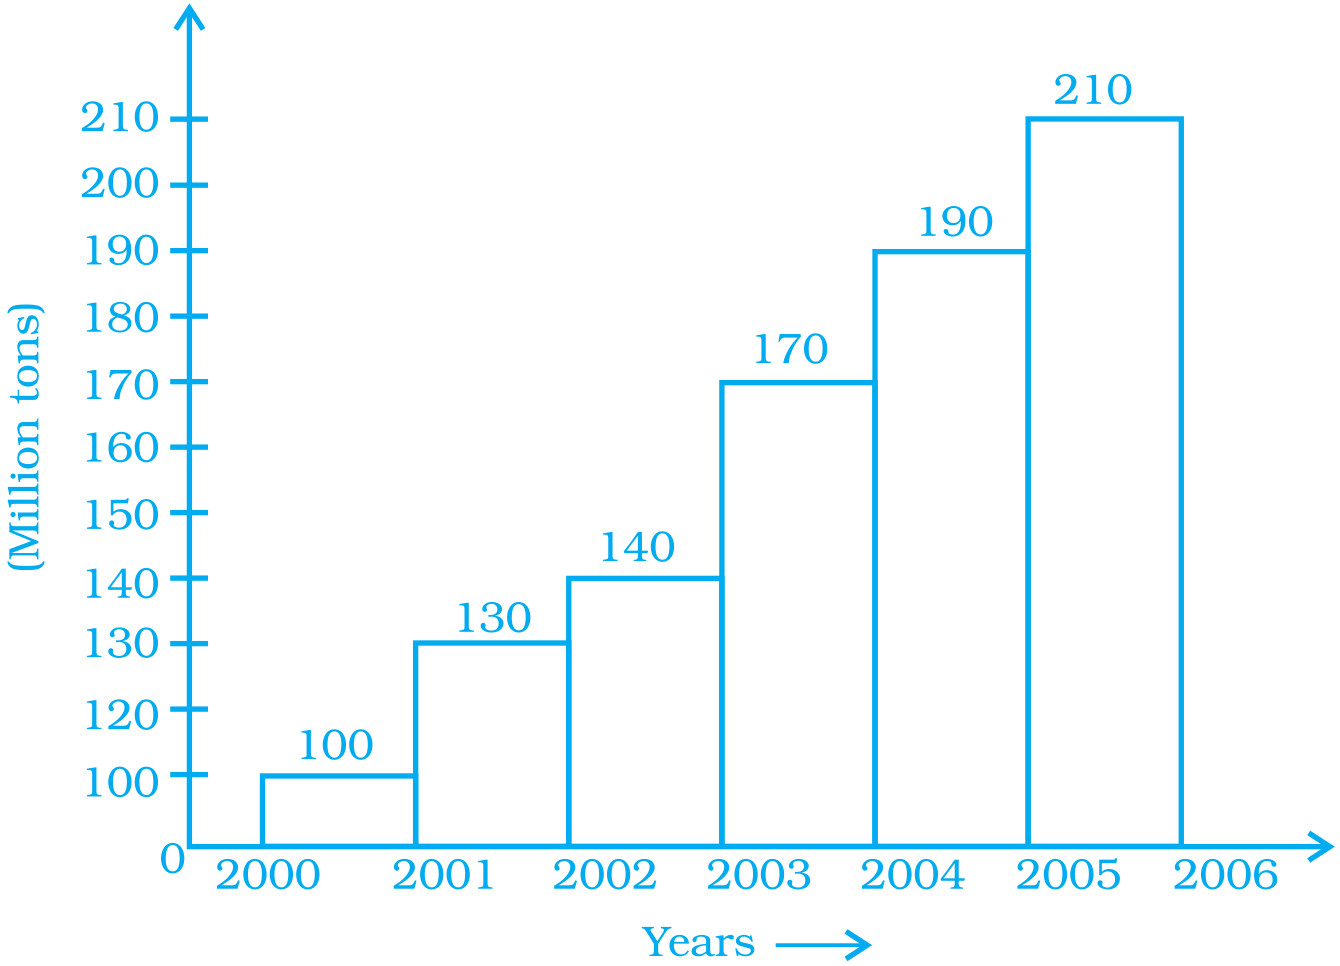
Question 241 Mark
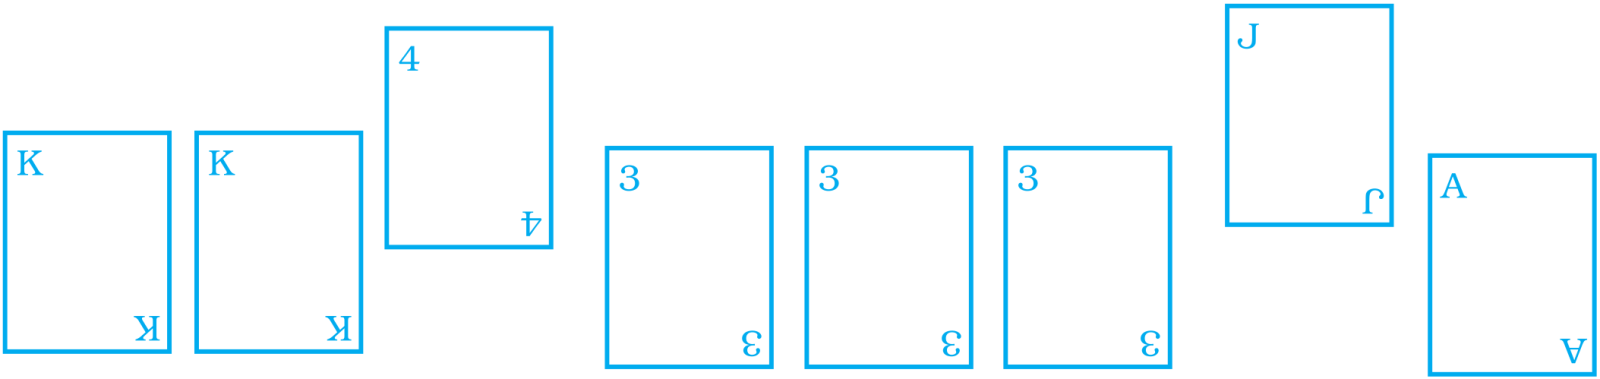
Playing cards: From a pack of cards the following cards are kept face down:
Suhail wins if he picks up a face card. Find the probability of Suhail winning? [Queen, King and Jack cards are called face cards.]
Answer$P($Suhail winning$) =\frac{1}{7} [$as there is only one face card$]$
View full question & answer→Question 251 Mark
Getting a prime number on throwing a die is an event.
Using the following frequency table, answer question $65-68$
|
Marks $($obtained out of $10)$
|
$4$
|
$5$
|
$7$
|
$8$
|
$9$
|
$10$
|
|
Frequency
|
$5$
|
$10$
|
$8$
|
$6$
|
$12$
|
$9$
|
AnswerTrue.
Solution:
Getting a prime number on throwing a die is an event.
View full question & answer→Question 261 Mark
The range of the data $6, 8, 16, 22, 8, 20, 7, 25$ is _____.
AnswerThe range of the data $6, 8, 16, 22, 8, 20, 7, 25$ is $19.$
Solution: Range of the given data $=$ Maximum value $-$ Minimum value $= 25 - 6 = 19$
View full question & answer→Question 271 Mark
In a histogram _____ are drawn with width equal to a class interval without leaving any gap in between.
AnswerIn a histogram bars are drawn with width equal to a class interval without leaving any gap in between.
View full question & answer→Question 281 Mark
Each outcome or a collection of outcomes in an experiment makes an _____.
AnswerEach outcome or a collection of outcomes in an experiment makes an event.
View full question & answer→Question 291 Mark
The number of people owning books less than $40$ is _____.
AnswerThe number of people owning books less than $40$ is $22.$
Solution:
The number of people owning books less than $40 = 8 + 14 = 22$
View full question & answer→Question 301 Mark
From the histogram given on the right, we can say that $1500$ males above the age of $20$ are literate.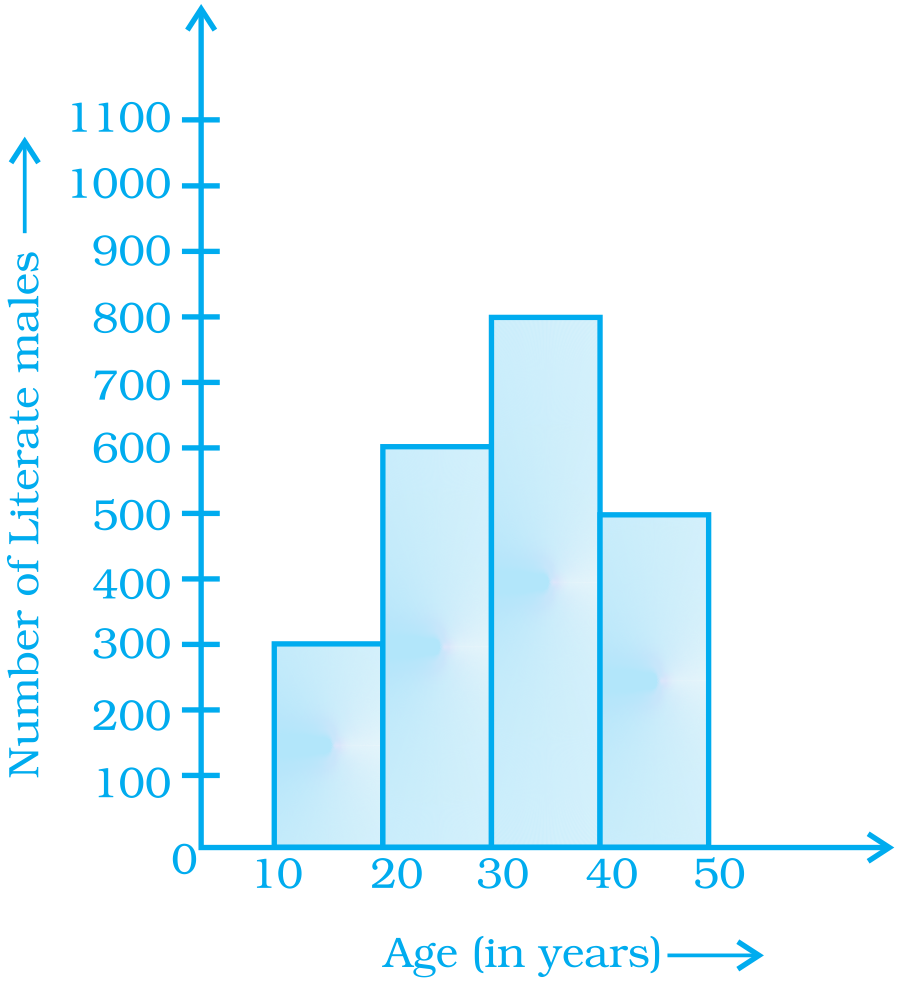
Answer Number of literate males above the age of $20$ year $= 600 + 800 + 500 = 1900$
View full question & answer→Question 311 Mark
The central angle of a sector in a pie chart cannot be more than $180^\circ$.
AnswerFalse.
Solution:
The central angle of a sector in a pie chart can be more than $180^\circ$, but not more than $360^\circ$.
View full question & answer→Question 321 Mark
If the fifth class interval is $60-65,$ fourth class interval is $55-60,$ then the first class interval is $45-50.$
AnswerIf Fifth class interval is $60-65$ and Fourth class interval is $55-60,$ Then Third class interval is $50-55,$ second class interval is $45-50$ And First class interval is $40-45.$
View full question & answer→Question 331 Mark
The class size of the class interval $60-68$ is $8.$
AnswerClass size of the class interval $60-68 =$ Upper class limit $-$ Lower class limit $= 68 - 60 = 8$
View full question & answer→Question 341 Mark
Sum of all the central angles in a pie chart is $360^\circ$.
AnswerTrue.
Solution:
Sum of all the central angles in a pie chart is $360^\circ$.
View full question & answer→Question 351 Mark
If a pair of coins is tossed, then the number of outcomes are $2.$
AnswerFalse. Solution: When a pair of coins is tossed, then the number of outcomes are $4,$ i.e. $HH, HT, TH$ and $TT.$
View full question & answer→Question 361 Mark
The probability of getting a prime number is the same as that of a composite number in a throw of a dice.
AnswerIn throw of a die, the occurrence of prime numbers can be as $2, 3, 5$ and occurrence of composite numbers can be as $4, 6.$ Hence, the probability of getting a prime number is $\frac{3}{6}$ and of getting is $\frac{2}{61},$ which is a composite not same.
View full question & answer→Question 371 Mark
In a pie chart two or more central angles can be equal.
AnswerTrue. Solution: In a pie chart two or more central angles can be equal.
View full question & answer→Question 381 Mark
In a pie chart a whole circle is divided into sectors.
AnswerTrue. Solution: In a pie chart, a whole circle is divided into sectors.
View full question & answer→Question 391 Mark
On throwing a dice once, the probability of occurence of a composite number is $\frac{1}{2}.$
AnswerFalse. Solution: On throwing a die, the occurrence of composite numbers can be as $4, 6.$
Hence, probability of occurrence of a composite number$=\frac{\text{Number of composite number sonadie}}{\text{Total number sonadie}}$ $=\frac{2}{6}$ $=\frac{1}{3}$
View full question & answer→Question 401 Mark
The difference between the upper and lower limit of a class interval is called the _____ of the class interval.
Answer The difference between the upper and lower limit of a class interval is called the size of the class interval.
View full question & answer→Question 411 Mark
On throwing a dice once, the probability of occurence of an even number is $\frac{1}{2}.$
AnswerTrue. Solution: On throwing a die, the occurrence of even numbers can be as $2, 4$ and $6.$ Hence, probability of occurrence of a even number $=\frac{\text{Number of even number sonadie}}{\text{Total number sonadie}}$
$=\frac{3}{6}$
$=\frac{1}{2}$
View full question & answer→Question 421 Mark
From the given pie chart, we can infer that production of Manganese is least in state $B.$
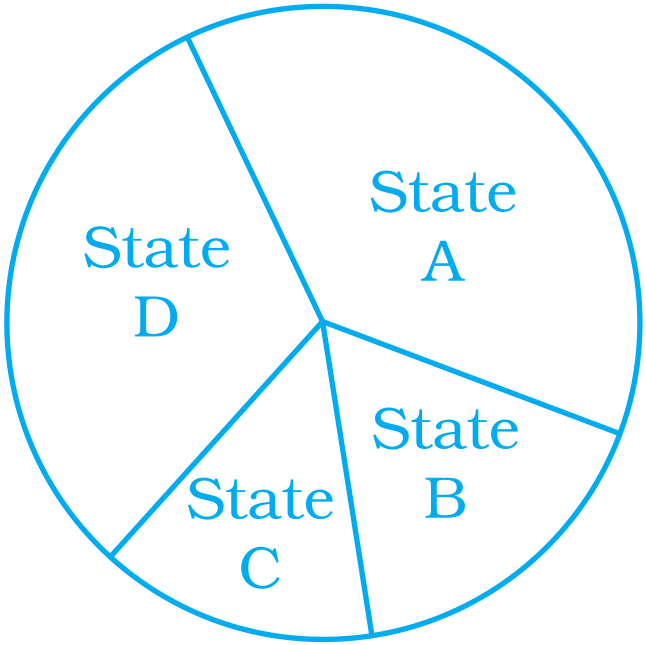
Prodiction of manganese in $4$ different states. AnswerFrom the given pie chart, we cannot infer that production of manganese is least in state $B.$ Unless we know the central angle for it.
View full question & answer→Question 431 Mark
In the class intervals $10-20, 20-30,$ etc., respectively, $20$ lies in the class _____.
AnswerIn the class intervals $10-20, 20-30,$ etc., respectively, $20$ lies in the class $20-30.$
View full question & answer→Question 441 Mark
To verify pythagoras theorem is a random experiment.
AnswerFalse. Solution: Verifying Pythagoras theorem is not a random experiment, because we already know the result.
View full question & answer→Question 451 Mark
A pie chart is used to compare _____ to a whole.
AnswerA pie chart is used to compare a part to a whole.
View full question & answer→Question 461 Mark
When a dice is thrown, outcomes $1, 2, 3, 4, 5, 6$ are equally _____.
AnswerWhen a dice is thrown, outcomes $1, 2, 3, 4, 5, 6$ are equally likely.
Solution:
As, their chances to appear are equal.
View full question & answer→Question 471 Mark
One or more outcomes of an experiment make an event.
Answer True.
Solution:
One or more outcomes of an experiment make an event.
View full question & answer→