Sample QuestionsData Handling questions
One sample from each question group in this chapter. Select any group above to see the full set with answer keys.
What is the central angle of the sector $($in the above pie chart$)$ representing hormones enzymes and other proteins.
- A
$120^\circ$
- ✓
$144^\circ$
- C
$156^\circ$
- D
$176^\circ$
Answer: B.
View full solution →The following pie chart gives the distribution of constituents in the human body. The central angle of the sector showing the distribution of protein and other constituents is:
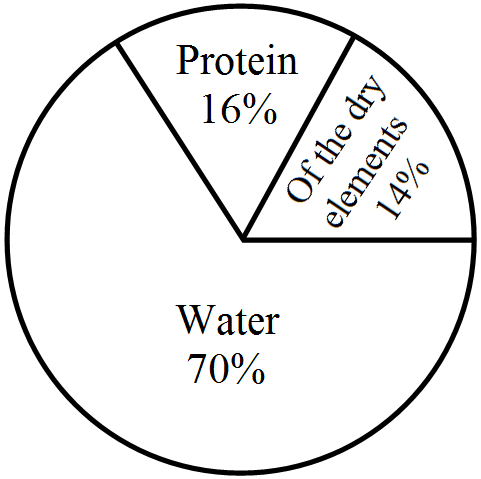
- ✓
$108^\circ$
- B
- C
- D
$216^\circ$
Answer: A.
View full solution →Which of the following is a reasonable conclusion for the given data?
Answer: D.
View full solution →A diece is tossed two times. The number of possible outcomes is:
Answer: C.
View full solution →Rahul, Varun and Yash are playing a game of spinning a coloured wheel. Rahul wins if spinner lands on red. Varun wins if spinner lands on blue and Yash wins if it lands on green. Which of the following spinner should be used to make the game fair?
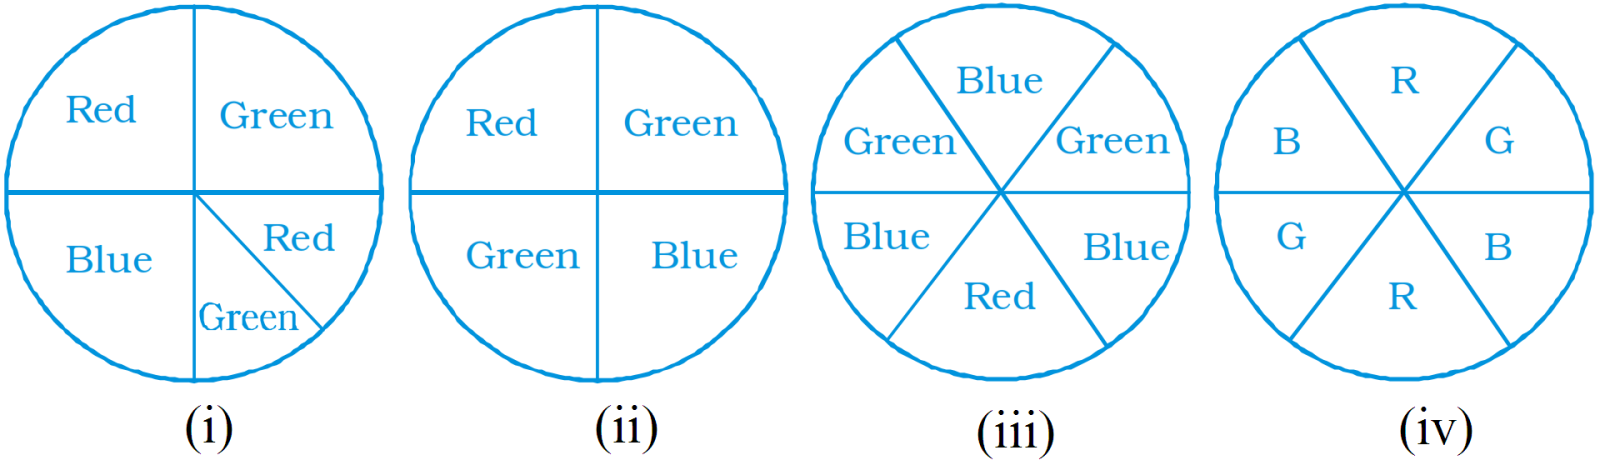
- A
$(i)$
- B
$(ii)$
- C
$(iii)$
- ✓
$(iv)$
Answer: D.
View full solution →Prepare a histogram from the frequency distribution table obtained in question $93$.
View full solution →Ritwik draws a ball from a bag that contains white and yellow balls. The probability of choosing a white ball is $\frac{2}{9}.$ If the total number of balls in the bag is $36$. fine the number of yellow balls.
View full solution →Following is a pie chart showing the amount spent in rupees $($in thousands$)$ by a company on various modes of advertising for a product. Now answer the following questions.
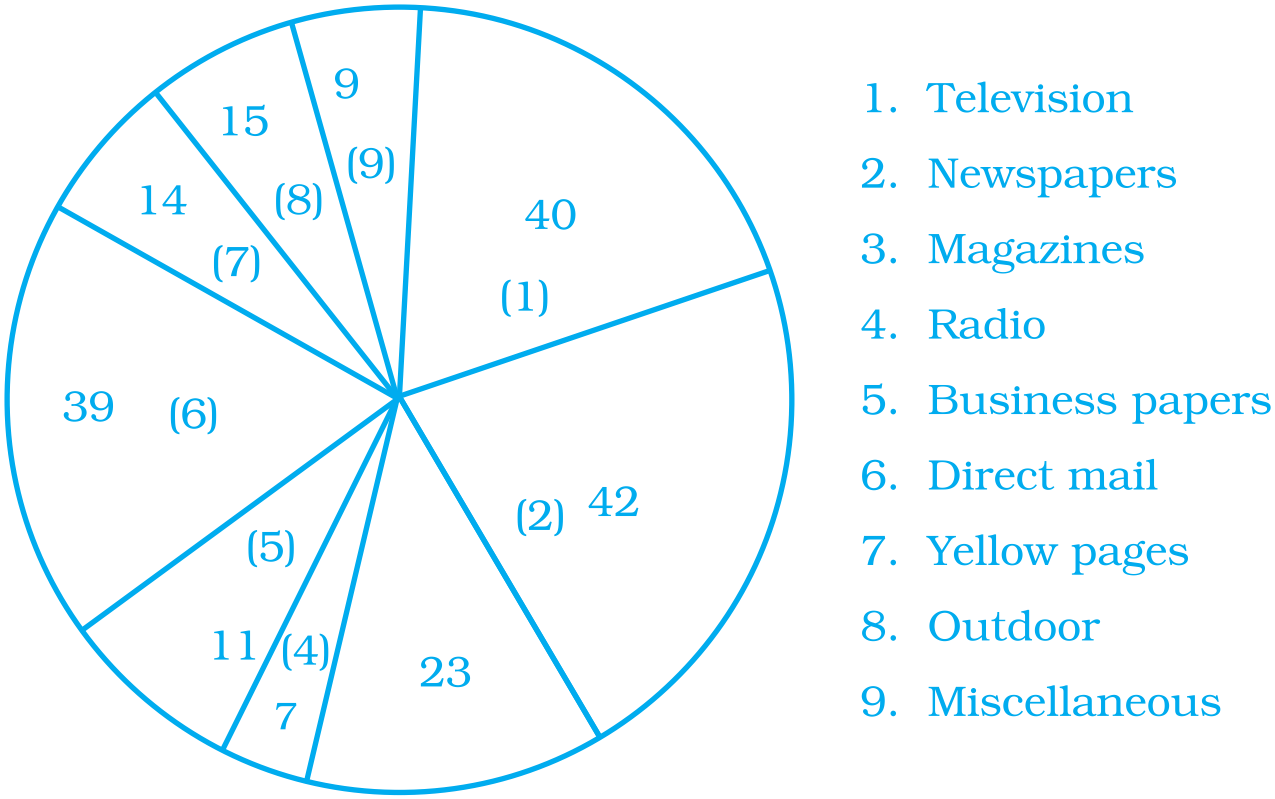
$i.$ Which type of media advertising is the greatest amount of the total?
$ii.$ Which type of media advertising is the least amount of the total?
$iii.$ What per cent of the total advertising amount is spent on direct mail campaigns?
$iv.$ What per cent of the advertising amount is spent on newspaper and magazine advertisements?
$v.$ What media types do you think are included in miscellaneous? Why aren’t those media types given their own category? View full solution →The weights $($ in $kg)$ of $30$ students of a class are:
$39, 38, 36, 38, 40, 42, 43, 44, 33, 33, 31, 45, 46, 38, 37, 31, 30, 39, 41, 41, 46, 36, 35, 34, 39, 43, 32, 37, 29, 26$.
Prepare a frequency distribution table using one class interval as $(30-35), 35$ not included.
$i.$ Which class has the least frequency?
$ii.$ Which class has the maximum frequency?
View full solution →Draw a histogram for the following data.
|
Class interval
|
$10-15$
|
$15-20$
|
$20-25$
|
$25-30$
|
$30-35$
|
$35-40$
|
|
Frequency
|
$30$
|
$98$
|
$80$
|
$58$
|
$29$
|
$50$
|
View full solution →At a Birthday Party, the children spin a wheel to get a gift. Find the probability of: 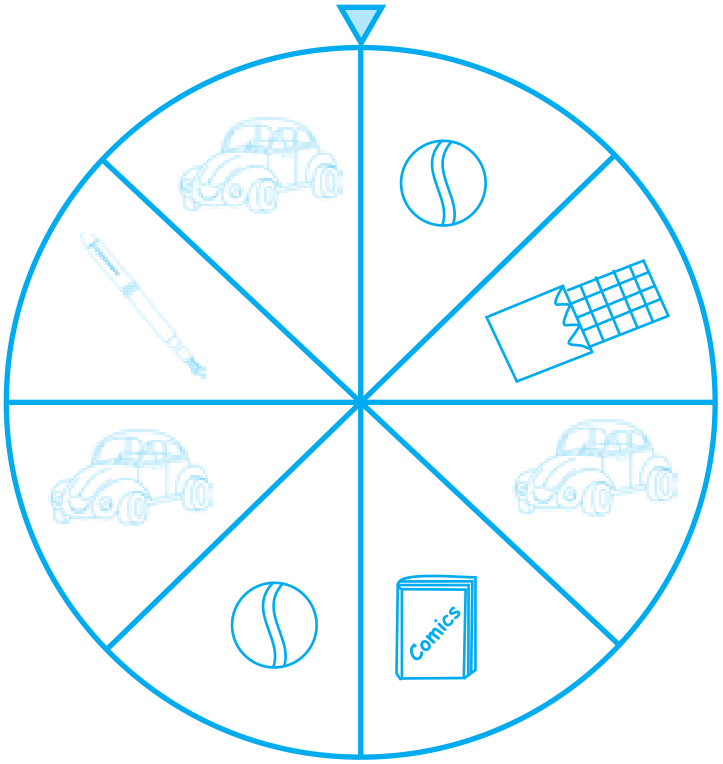
$a.$ Getting a ball.
$b.$ Getting a toy car.
$c.$ Any toy except a chocolate. View full solution →Complete the following table:
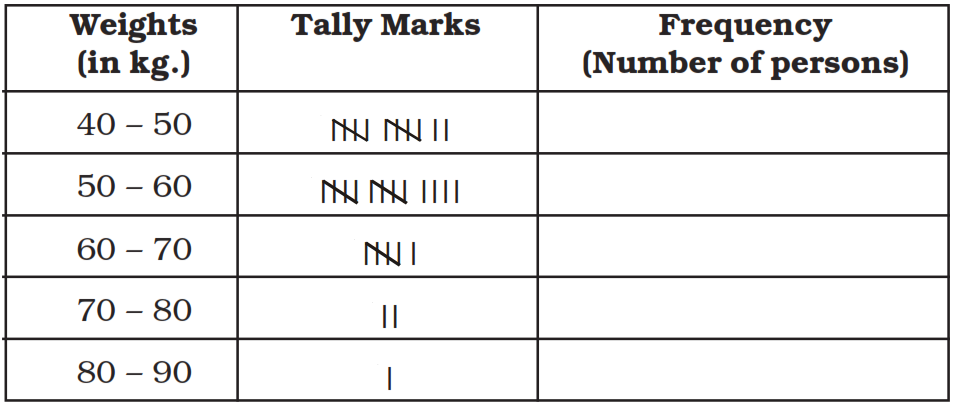
Find the total number of persons whose weights are given in the above table.
Construct a frequency distribution table for the following weights $($in grams$)$ of $35$ mangoes, using the equal class intervals, one of them is $40-45 (45$ not included$).$
$30, 40, 45, 32, 43, 50, 55, 62, 70, 70, 61, 62, 53, 52, 50,$
$42, 35, 37, 53, 55, 65, 70, 73, 74, 45, 46, 58, 59, 60, 62, 74, 34, 35, 70, 68.$
$a.$ How many classes are there in the frequency distribution table?
$b.$ Which weight group has the highest frequency?
View full solution →The following pie chart depicts the expenditure of a state government under different heads.
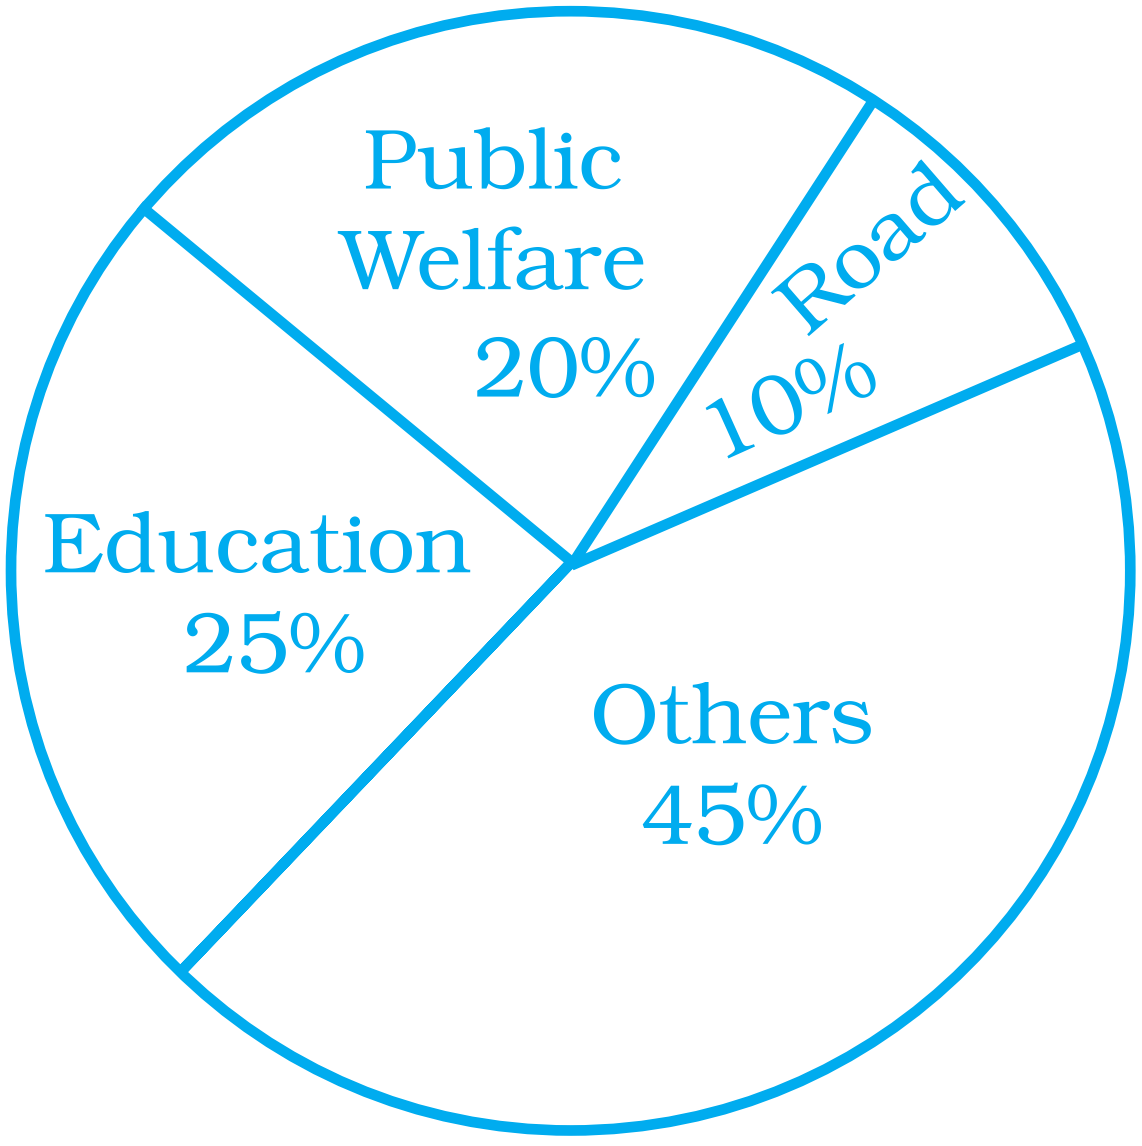
$i.$ If the total spending is $10$ crores, how much money was spent on roads?
$ii.$ How many times is the amount of money spent on education compared to the amount spent on roads?
$iii.$ What fraction of the total expenditure is spent on both roads and public welfare together? View full solution →The following histogram shows the frequency distribution of teaching experiences of $30$ teachers in various schools:
$a.$ What is the class width?
$b.$ How many teachers are having the maximum teaching experience and how many have the least teaching experience?
$c.$ How many teachers have teaching experience of $10$ to $20$ years?
View full solution →Shoes of the following brands are sold in Nov. $2007$ at a shoe store. Construct a pie chart for the data.
|
Brand
|
Number of pair of shoes sold
|
|
$A$
|
$130$
|
|
$B$
|
$120$
|
|
$C$
|
$90$
|
|
$D$
|
$40$
|
|
$E$
|
$20$
|
View full solution →Study the pie chart given below depicting the marks scored by a student in an examination out of $540$. Find the marks obtained by him in each subject.
View full solution →In the time table of a school, periods allotted per week to different teaching subjects are given below:
|
Subject
|
Hindi
|
English
|
Maths |
Science
|
Social Science |
Computer |
Sanskrit |
|
Periods Allotted
|
$7$
|
$8$
|
$8$
|
$8$
|
$7$ |
$4$ |
$3$ |
Draw a pie chart for this data. View full solution →The following data represents the different number of animals in a zoo. Prepare a pie chart for the given data.
|
Animals
|
Number of animals
|
|
Deer
|
$42$
|
|
Elephant
|
$15$
|
|
Giraffe
|
$26$
|
|
Reptiles
|
$24$
|
|
Tiger
|
$13$
|
View full solution →Classify the following statements under appropriate headings.
$a.$ Getting the sum of angles of a triangle as $180^\circ$.
$b.$ India winning a cricket match against Pakistan.
$c.$ Sun setting in the evening.
$d.$ Getting $7$ when a die is thrown.
$e.$ Sun rising from the west.
$f.$ Winning a racing competition by you.
|
Certain to happen
|
Impossible to happen
|
May or may not happen
|
|
|
|
|
|
|
|
|
View full solution →The class size of the interval $80-85$ is _____.
View full solution →The frequency of more than $8$ marks is $21.$
View full solution →The probability of getting number 6 in a throw of a dice is $\frac{1}{6}.$ Similarly the probability of getting a number $5$ is $\frac{1}{5}.$
View full solution →In a pie chart two central angles can be of $180^\circ$.
View full solution →The total number of people surveyed is _____.