Question 33 Marks
Construct a frequency distribution table for the following weights $($in grams$)$ of $35$ mangoes, using the equal class intervals, one of them is $40-45 (45$ not included$).$
$30, 40, 45, 32, 43, 50, 55, 62, 70, 70, 61, 62, 53, 52, 50,$
$42, 35, 37, 53, 55, 65, 70, 73, 74, 45, 46, 58, 59, 60, 62, 74, 34, 35, 70, 68.$
$a.$ How many classes are there in the frequency distribution table?
$b.$ Which weight group has the highest frequency?
Answer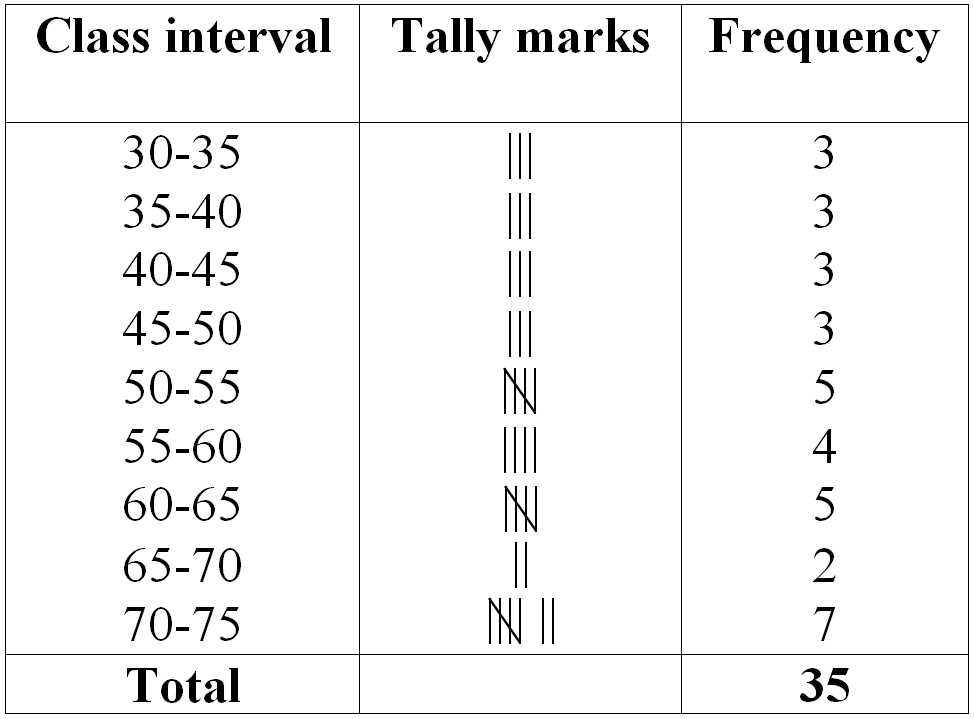
$a.$ There are total number of $9$ classes in the frequency distribution table.
$b.$ The weight group $70-75$ has the highest frequency, i.e. $7.$ View full question & answer→Question 53 Marks
The following histogram shows the frequency distribution of teaching experiences of $30$ teachers in various schools:
$a.$ What is the class width?
$b.$ How many teachers are having the maximum teaching experience and how many have the least teaching experience?
$c.$ How many teachers have teaching experience of $10$ to $20$ years?
Answer$a.$ In the histogram, we see that the class width Is $5.$
$b.$ By the histogram, it is clear that two teachers have the maximum teaching experience,
i.e. $15-20$ years, and five teachers have the least teaching experience,
i.e. $0-5$ years.
$c.$ The number of teachers having experience from $10$ to $20$ years, is $7 + 2,$
i.e. $9.$
View full question & answer→Question 83 Marks
A dice is rolled once. What is the probability that the number on top will be:
$a.$ Odd
$b.$ Greater than $5$
$c.$ A multiple of $3$
$d.$ Less than $1$
$e.$ A factor of $36$
$f.$ A factor of $6$
AnswerWhen a die is rolled once, Then the possible outcomes are $1, 2, 3, 4, 5$ and $6.$
$a.$ Odd $=\frac{3}{6}=\frac{1}{2}$
$b.$ Greater than $5=\frac{1}{6}$
$c.$ A multiple of $3=\frac{2}{6}=\frac{1}{3}$
$d.$ Less than $1=0$
$e.$ A factor of $36=\frac{5}{6}$
$f.$ A factor of $6=\frac{4}{6}=\frac{2}{3}$
View full question & answer→Question 93 Marks
In a hypothetical sample of 20 people, the amount of money (in thousands of rupees) with each was found to be as follows:
$114, 108, 100, 98, 101, 109, 117, 119, 126, 131, 136, 143, 156, 169, 182, 195, 207, 219, 235, 118.$
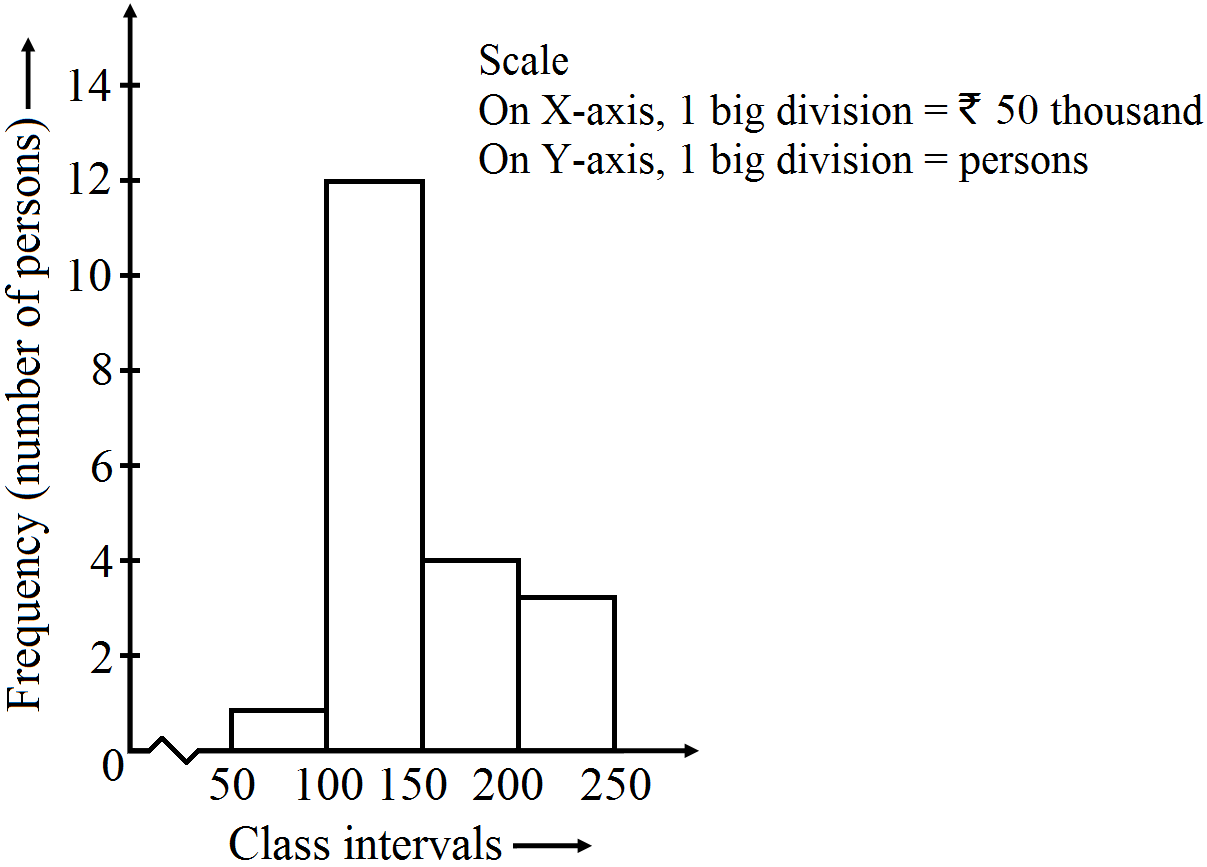
Draw a histogram of the frequency distribution, taking one of the class intervals as $50-100.$
AnswerBefore preparing histogram of the given data, we will prepare the frequency distribution table.
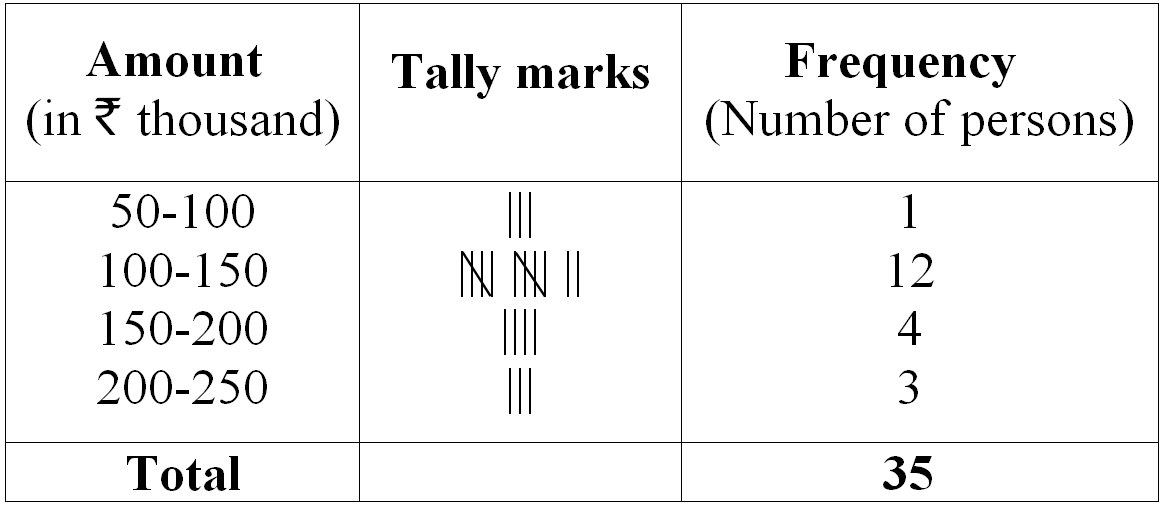
View full question & answer→Question 103 Marks
Look at the histogram below and answer the questions that follow.
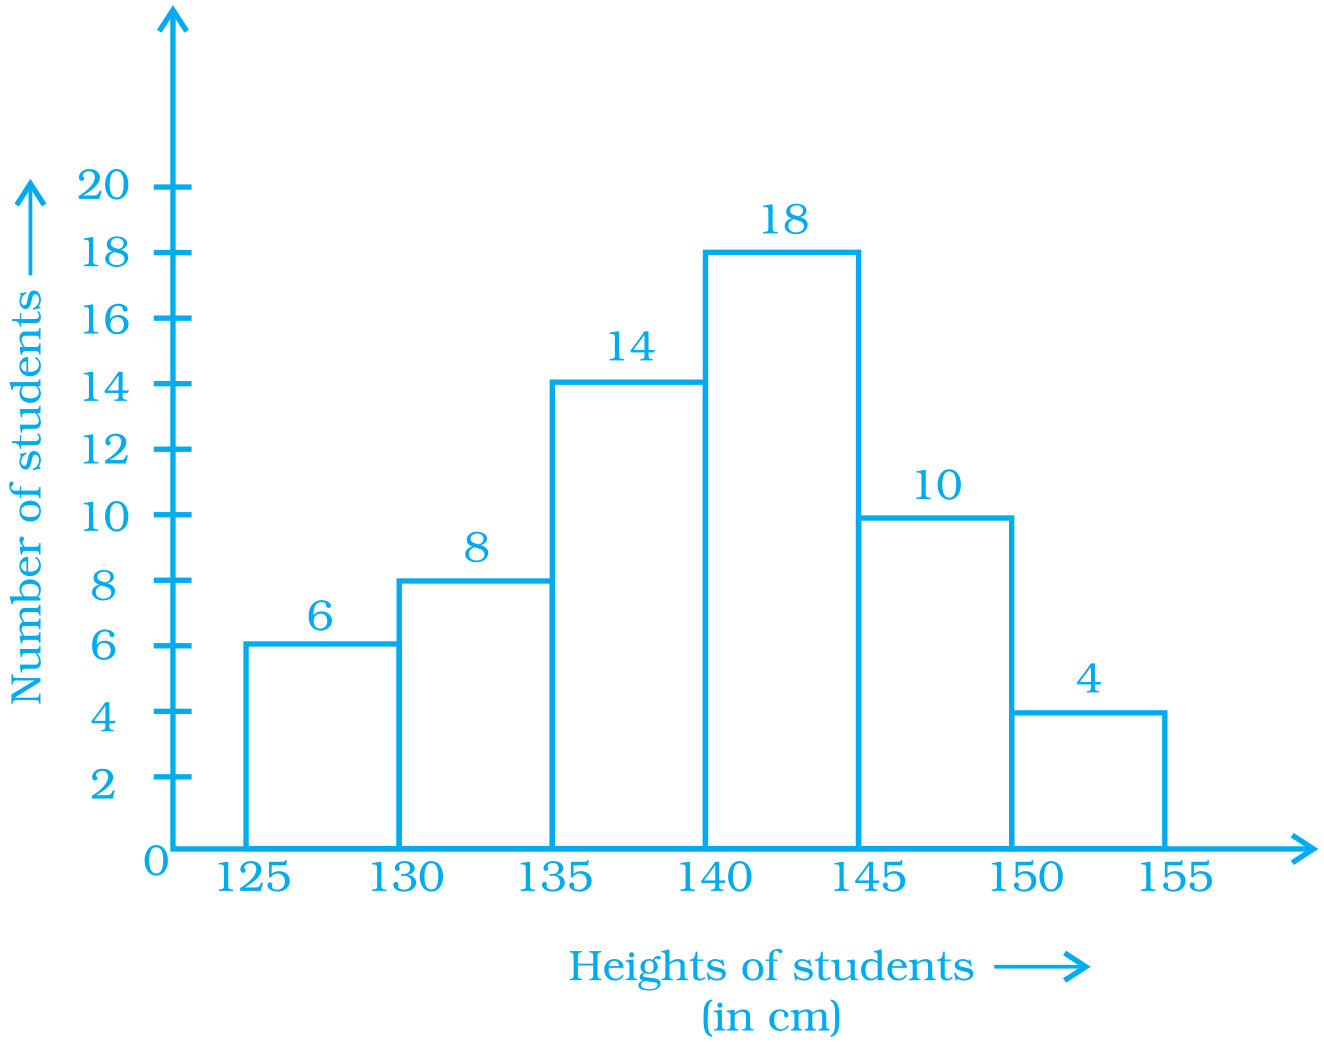
$a.$ How many students have height more than or equal to $135\ cm$ but less than $150\ cm?$
$b.$ Which class interval has the least number of students?
$c.$ What is the class size?
$d.$ How many students have height less than $140\ cm?$ Answer$a.$ Number of students who have height more than or equal to $135 \ cm$ , but less than $150 \ cm=14+18+10=42$.
$b.$ The class interval $150-155$ has the least number of students, i.e. $4 .$
$c.$ We know, class size $=$ Upper class limit $-$ Lower class limit Consider any class, say $(125-130)$, then class size $= 130-125 = 5$
Hence, the class size is $5 .$
$d.$ Number of students who have height less than $140 \ cm=6+8+14=28$.
View full question & answer→Question 183 Marks
The below histogram shows the number of literate females in the age group of $10$ to $40$ years in a town. 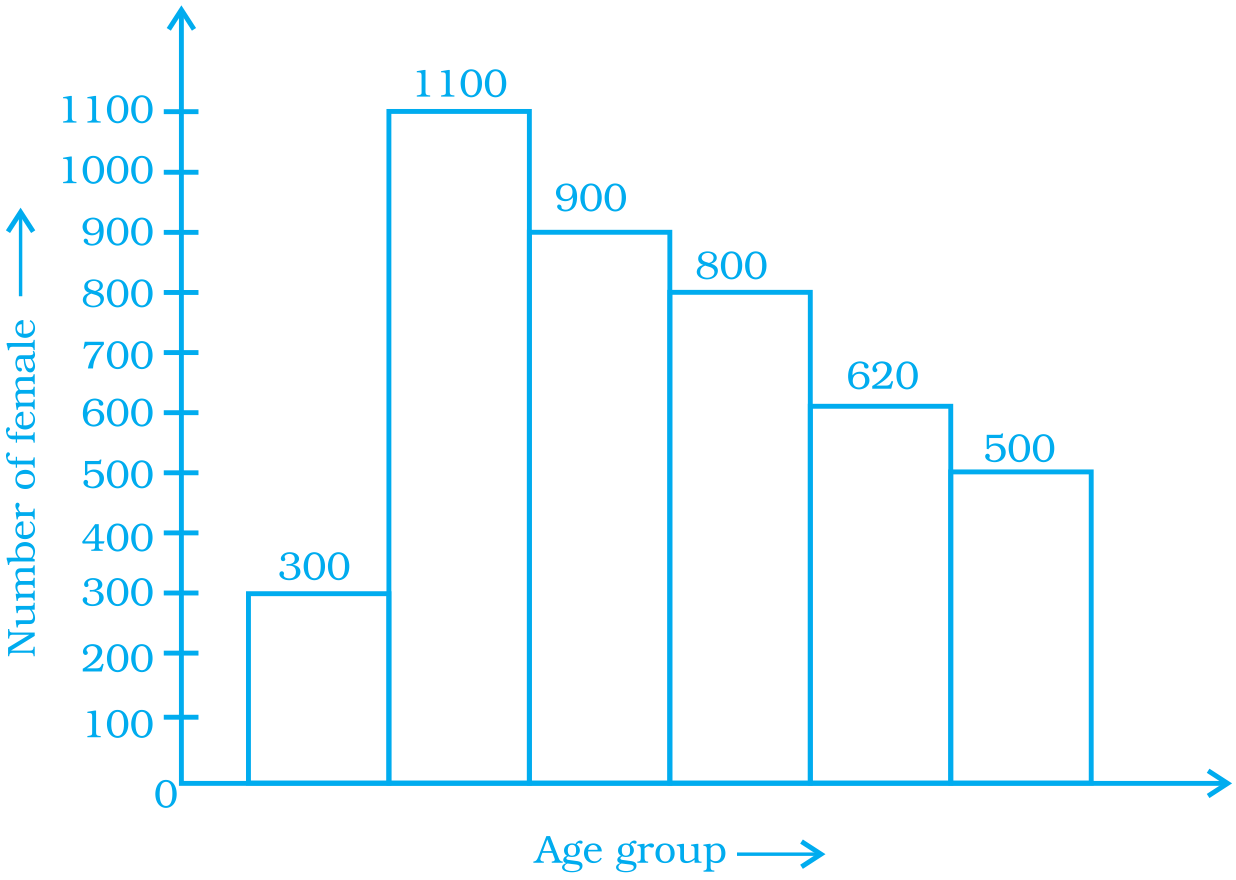
$a.$ Write the classes assuming all the classes are of equal width.
$b.$ What is the classes width?
$c.$ In which age group are literate females the least?
$d.$ In which age group is the number of literate females the highest? Answer$a.$ As we know that, the age group of $10 yr$ to $40 yr$ is to be divided into classes of equal width, starting with $10$. Then, the classes of equal width can be written as. $10-15, 15-20, 20-25, 25-30, 30-35, 35-40,$
$b.$ The width of the classes is $5$, as the difference between upper class limit and lower class limit is $5.$
$c.$ In the age group of $10-15$, the number of literate females is the least.
$d.$ In the age group of $15-20$, the number of literate females is the highest.
View full question & answer→