Question 15 Marks
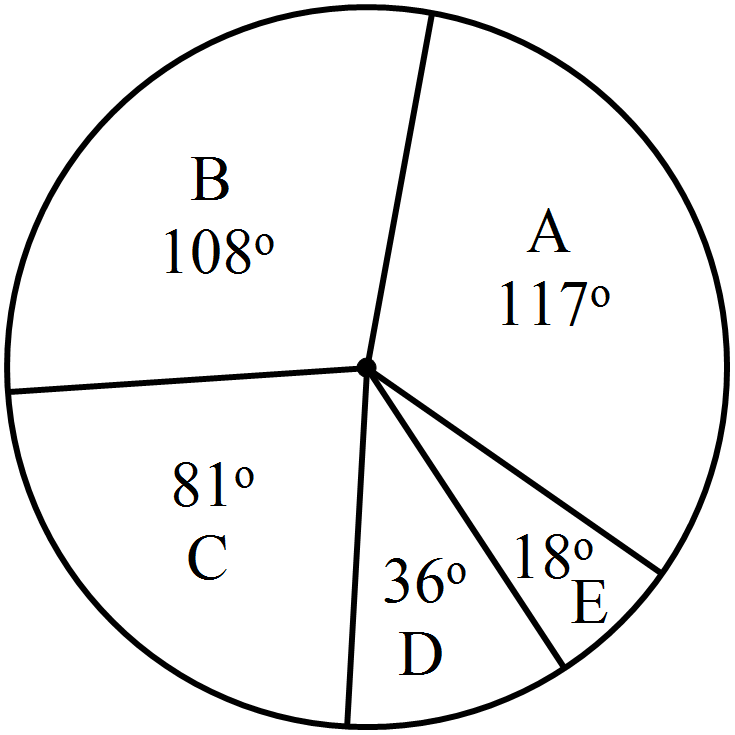
Shoes of the following brands are sold in Nov. $2007$ at a shoe store. Construct a pie chart for the data.
|
Brand
|
Number of pair of shoes sold
|
|
$A$
|
$130$
|
|
$B$
|
$120$
|
|
$C$
|
$90$
|
|
$D$
|
$40$
|
|
$E$
|
$20$
|
Answer
View full question & answer→Total number of pairs of shoes sold$ = (130 + 120 + 90 + 40 + 20) = 400$
$\therefore$ Central angle of pie chart representing the brand
$i. \text{A}=\frac{130}{400}\times360^\circ=117^\circ$
$ii. \text{B}=\frac{120}{400}\times360^\circ=108^\circ$
$iii. \text{C}=\frac{90}{40}\times360^\circ=81^\circ$
$iv. \text{D}=\frac{40}{400}\times360^\circ=36^\circ$
$v. \text{E}=\frac{20}{400}\times360^\circ=18^\circ$