The weekly wages (in rupees) of 28 workers of a factory are given below: $668, 610, 642, 658, 668, 620, 719, 720, 700, 690, 710, 642, 672, 654, 692, 706, 718, 702, 704, 678, 615, 640, 680, 716, 705, 615, 636, 656$. Construct a frequency table with equal class intervals, taking the first of the class intervals as $610-630$, where $630$ is not included.
View full solution →Question types
Data Handling question types
20 questions across 2 question groups — pick any mix to generate a Maths paper with step-by-step answer keys.
20
Questions
2
Question groups
5
Question types
Sample Questions
Data Handling questions
One sample from each question group in this chapter. Select any group above to see the full set with answer keys.
A dice was thrown 30 times and the following outcomes were noted: 2, 1, 2, 4, 6, 1, 2, 3, 6, 5, 4, 4, 3, 1, 1, 3, 1, 1, 5, 6, 6, 2, 2, 3, 4, 2, 5, 5, 6, 4. Prepare a frequency table.
The number of members in $20$ families are given below: $4, 6, 5, 5, 4, 6, 3, 3, 5, 5, 3, 5, 4, 4, 6, 7, 3, 5, 5, 7$. Prepare a frequency distribution of the data.
View full solution →The following data gives the number of children in $40$ families:
$1, 2, 6, 5, 1, 5, 1, 3, 2, 6, 2, 3, 4, 2, 0, 4, 4, 3, 2, 2, 0, 0, 1, 2, 2, 4, 3, 2, 1, 0, 5, 1, 2, 4, 3, 4, 1, 6, 2, 2$.
Represent it in the form of a frequency distribution.
View full solution →$1, 2, 6, 5, 1, 5, 1, 3, 2, 6, 2, 3, 4, 2, 0, 4, 4, 3, 2, 2, 0, 0, 1, 2, 2, 4, 3, 2, 1, 0, 5, 1, 2, 4, 3, 4, 1, 6, 2, 2$.
Represent it in the form of a frequency distribution.
The daily earnings (in rupees) of $24$ stores in a market was recorded as under:
$715, 650, 685, 550, 573, 530, 610, 525, 742, 680, 736, 524, 500, 585, 723, 545, 532, 560, 580, 545, 625, 630, 645, 700.$
Prepare a frequency table taking equal class sizes. One such class is $500-550$, where $550$ is not included.
View full solution →$715, 650, 685, 550, 573, 530, 610, 525, 742, 680, 736, 524, 500, 585, 723, 545, 532, 560, 580, 545, 625, 630, 645, 700.$
Prepare a frequency table taking equal class sizes. One such class is $500-550$, where $550$ is not included.
Look at the histogram given below and answer the question that follow:
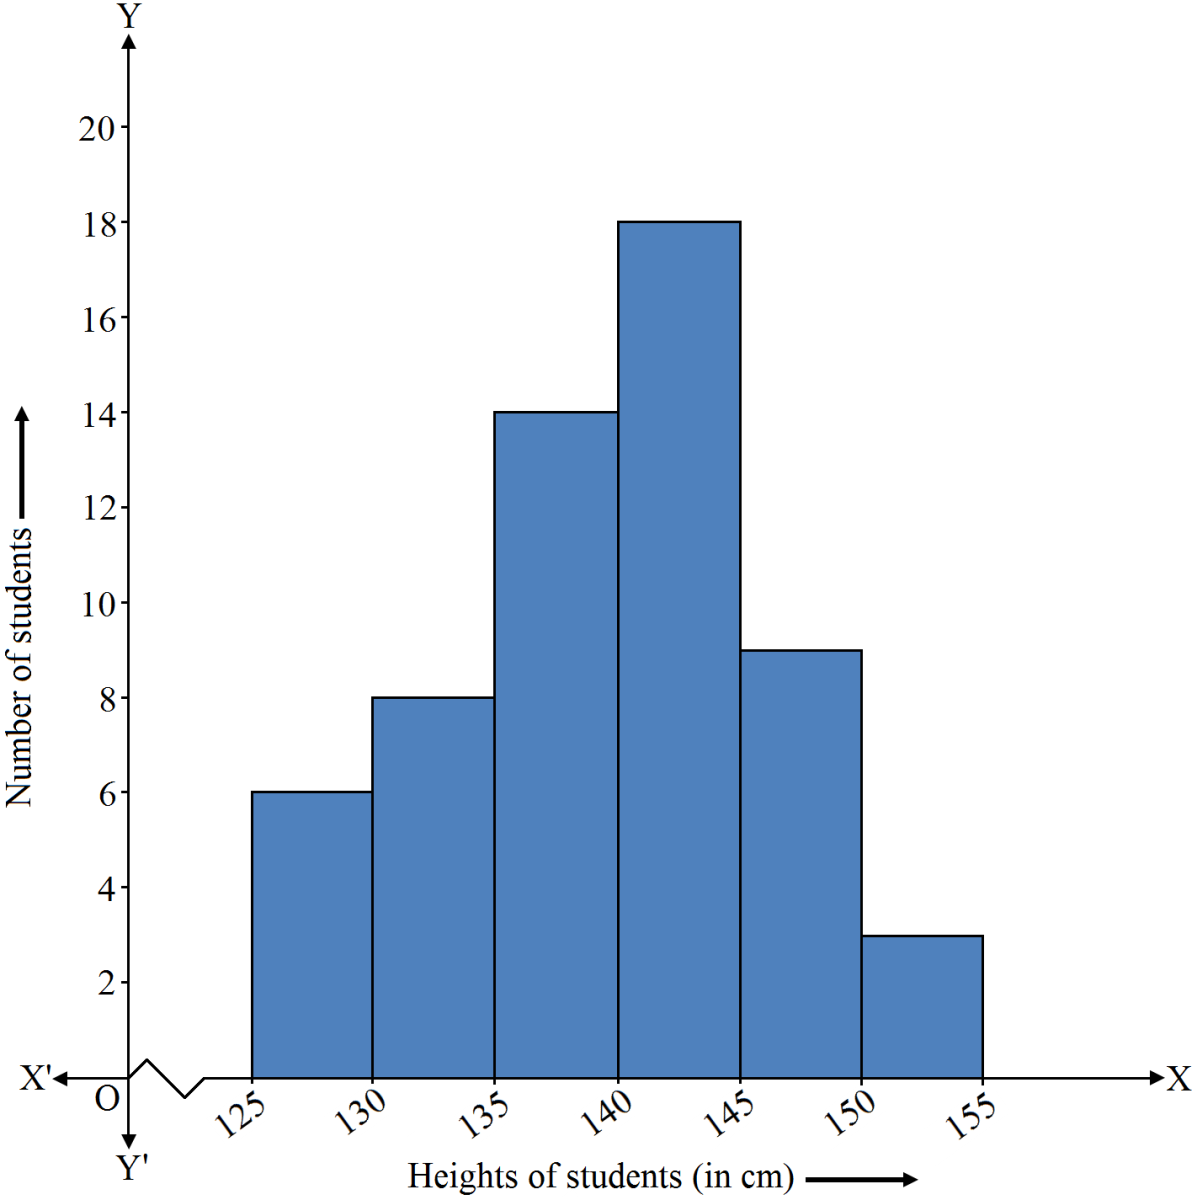
$i.$ How many students have height more than or equal to $135\ cm$ but less than $150\ cm?$
$ii.$ Which class interval has the least number of students?
$iii.$ What is the class size?
$iv.$ How many students have height less than $140\ cm?$
View full solution →$i.$ How many students have height more than or equal to $135\ cm$ but less than $150\ cm?$
$ii.$ Which class interval has the least number of students?
$iii.$ What is the class size?
$iv.$ How many students have height less than $140\ cm?$
The histogram given below shows the number of literate females in the age group of $10$ to $40$ years. Study the histogram carefully and answer the question that follow:
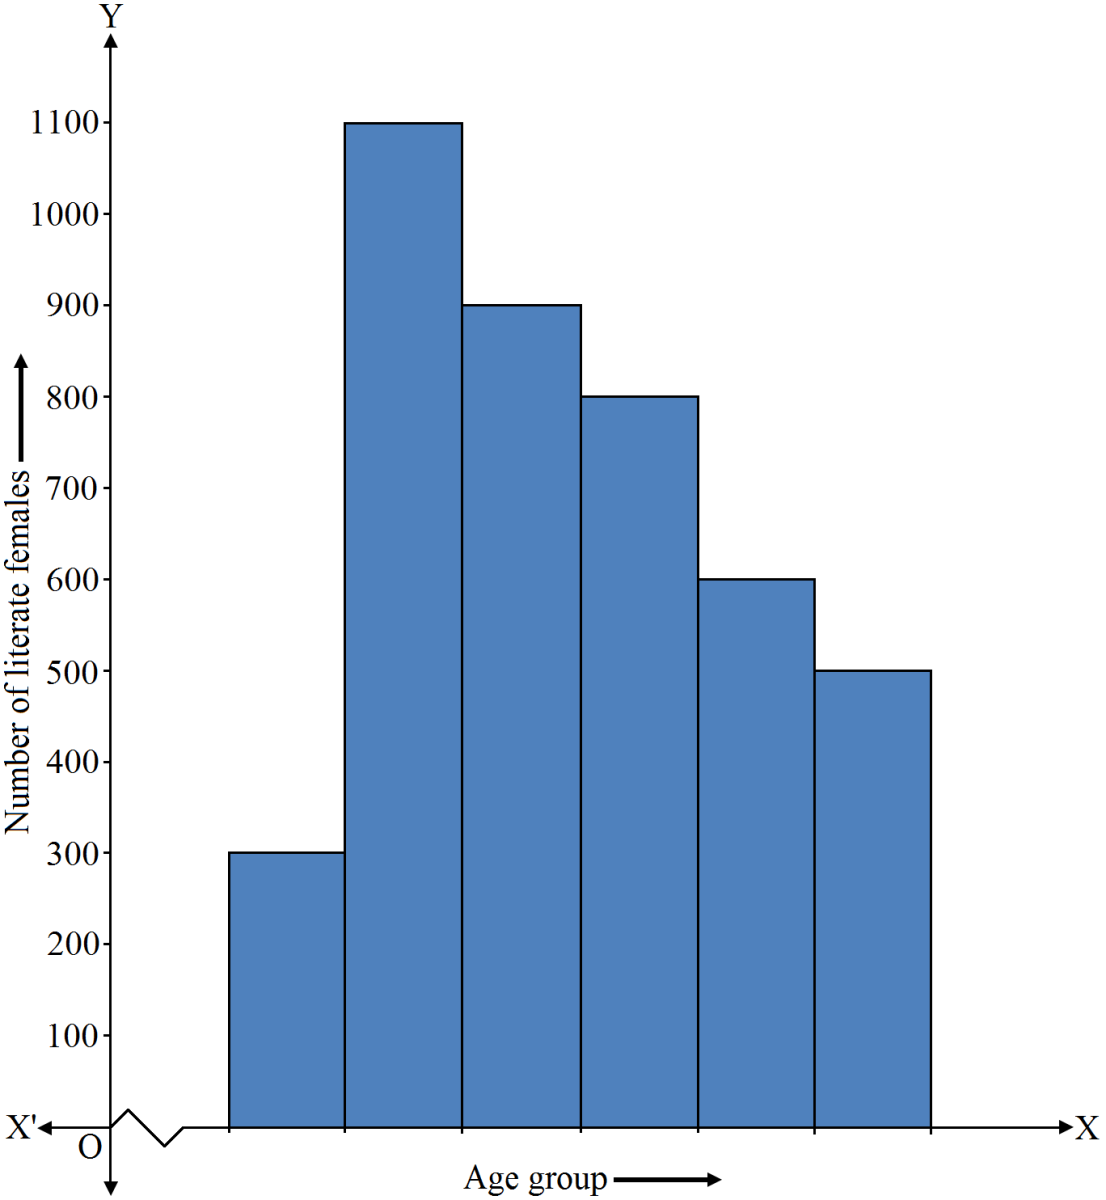
$i.$ Write the classes, assuming that all the classes are of equal width.
$ii.$ What is the class width?
$iii.$ In which age group are the literate females the least?
$iv.$ In which age group is the number of literate females the highest?
Hint. Number of class intervals of equal width $= 6 ($given$)$, class width $=\frac{(40-10)}{6}=5.$
View full solution →$i.$ Write the classes, assuming that all the classes are of equal width.
$ii.$ What is the class width?
$iii.$ In which age group are the literate females the least?
$iv.$ In which age group is the number of literate females the highest?
Hint. Number of class intervals of equal width $= 6 ($given$)$, class width $=\frac{(40-10)}{6}=5.$
Draw a histogram for the frequency distribution of following data:
Hint. Take 1 small division $= 10.$
View full solution →|
Class interval
|
$8-13$
|
$13-18$
|
$18-23$
|
$23-28$
|
$28-33$
|
$33-38$
|
$38-43$
|
|
Frequency
|
$320$
|
$780$
|
$160$
|
$540$
|
$260$
|
$100$
|
$80$
|
Draw a histogram for the frequency distribution of following data:
View full solution →|
Class interval
|
$20-25$
|
$25-30$
|
$30-35$
|
$35-40$
|
$40-45$
|
$45-50$
|
|
Frequency
|
$30$
|
$24$
|
$52$
|
$28$
|
$46$
|
$10$
|
Draw a histogram for the following data:
Hint. Take $1$ small division $= 3.$
View full solution →|
Class interval
|
$600-640$ | $640-680$ |
$680-720$
|
$720-760$
|
$760-800$
|
$800-840$
|
|
Frequency
|
$18$ | $45$ |
$153$
|
$288$
|
$171$
|
$63$
|
Generate a Data Handling paper free
Pick question groups from the list above, set marks and difficulty, and export a branded PDF with step-by-step answer keys. First 3 chapters free — no signup.