Questions

5 Marks Questions

🎯

Test yourself on this topic

10 questions · timed · auto-graded

Question 15 Marks
Look at the histogram given below and answer the question that follow:

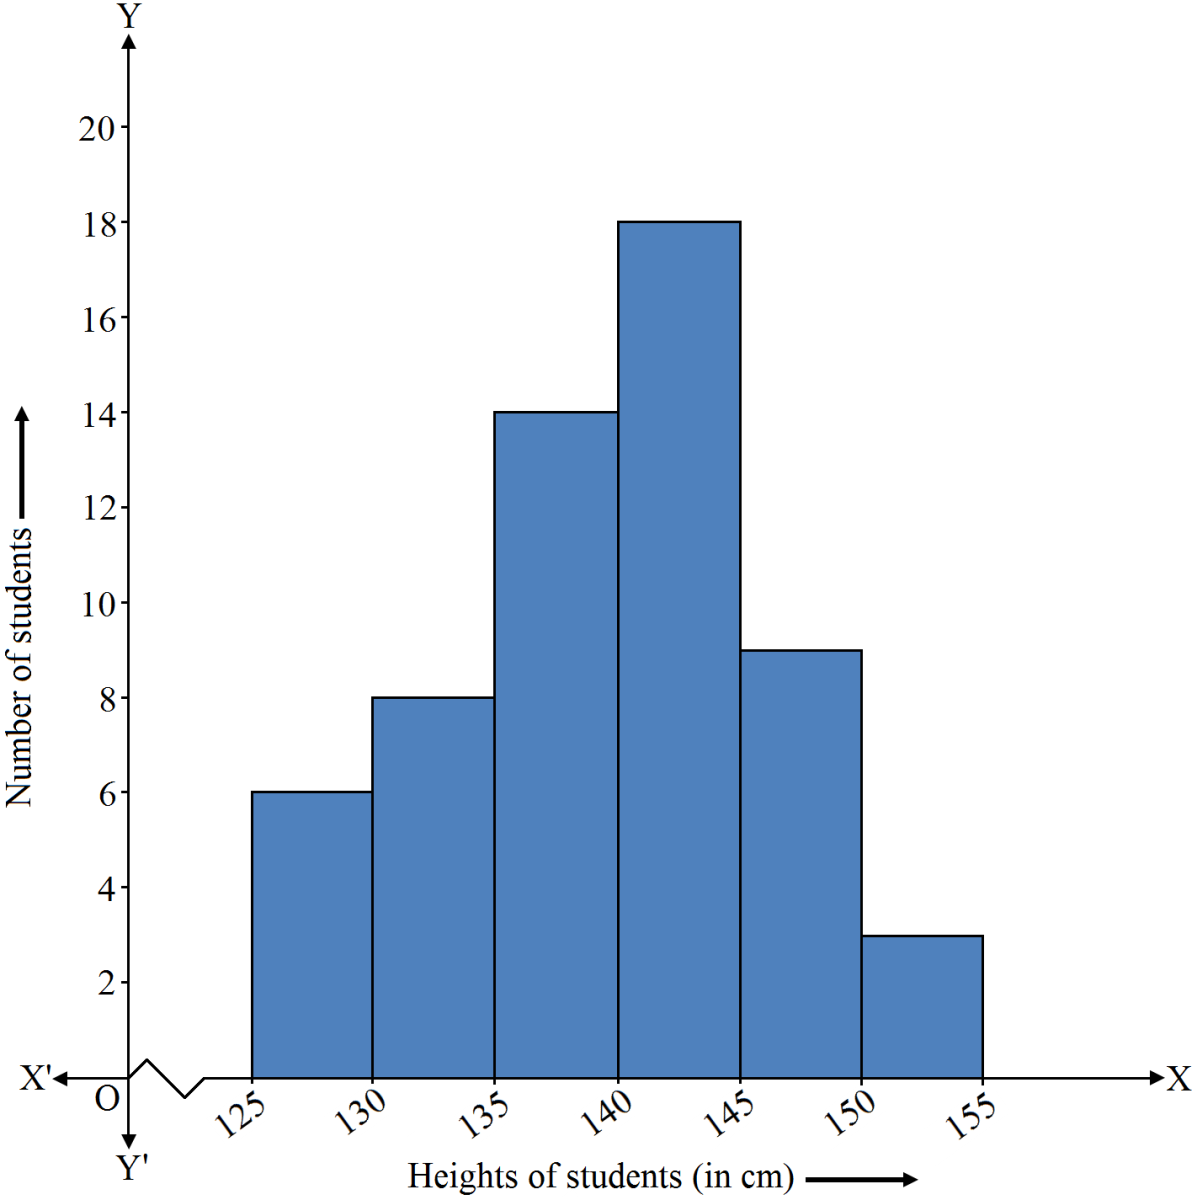
$i.$ How many students have height more than or equal to $135\ cm$ but less than $150\ cm?$
$ii.$ Which class interval has the least number of students?
$iii.$ What is the class size?
$iv.$ How many students have height less than $140\ cm?$
Answer
$i.$ Number of students $= 14 + 18 + 10 = 42$
$ii.$ Class interval with least number of students $= 150 - 155$
$iii.$ Class size $= 130 - 125 = 5$
$iv.$ Number of students with height less than $140 = 14 + 8 + 6 = 28$
View full question & answer
Question 25 Marks
The histogram given below shows the number of literate females in the age group of $10$ to $40$ years. Study the histogram carefully and answer the question that follow:

$i.$ Write the classes, assuming that all the classes are of equal width.
$ii.$ What is the class width?
$iii.$ In which age group are the literate females the least?
$iv.$ In which age group is the number of literate females the highest?
Hint. Number of class intervals of equal width $= 6 ($given$)$, class width $=\frac{(40-10)}{6}=5.$
Answer
$i.$ Age group $= 10$ to $40$
Given all the classes are of equal width
Number of class interval of equal width $= 6$
Class width $=\frac{40-10}{6}=5$
Classes are $10-15,15-20, 20-25, 25-30, 30-35, 35-40$
$ii.$ Class width $ = \frac{40−10}{6}=5$
$iii.$ Age group with least literate females $= 10-15$
$iv.$ Age group with highest literate females $= 15-20$
View full question & answer
Question 35 Marks
Draw a histogram for the frequency distribution of following data:
Class interval
$8-13$
$13-18$
$18-23$
$23-28$
$28-33$
$33-38$
$38-43$
Frequency
$320$
$780$
$160$
$540$
$260$
$100$
$80$
Hint. Take 1 small division $= 10.$
View full question & answer
Question 45 Marks
Draw a histogram for the frequency distribution of following data:
Class interval
$20-25$
$25-30$
$30-35$
$35-40$
$40-45$
$45-50$
Frequency
$30$
$24$
$52$
$28$
$46$
$10$
View full question & answer
Question 55 Marks
Draw a histogram for the following data:
Class interval
$600-640$ $640-680$
$680-720$
$720-760$
$760-800$
$800-840$
Frequency
$18$ $45$
$153$
$288$
$171$
$63$
Hint. Take $1$ small division $= 3.$
View full question & answer
Question 65 Marks
The top speeds of $30$ different land animals have been organised into a frequency table given below:
Maximum speed (in km/ h)
$10-20$
$20-30$
$30-40$
$40-50$
$50-60$
$60-70$
Number of animals
$3$
$5$
$10$
$8$
$0$
$2$
Draw a histogram for the given data.
View full question & answer
Question 75 Marks
The following table shows the number of illiterate persons in the age group ($10–58$ years) in a town. Represent the given data by means of a histogram.
Age group (in years) $10-18$ $18-26$
$26-34$
$34-42$
$42-50$
$50-58$
Number of illiterate persons $175$ $325$
$100$
$150$
$250$
$525$
Hint. Take $1$ small division $= 5$ persons.
View full question & answer
Question 85 Marks
The ages (in years) of $360$ patients treated in a hospital on a particular day are given below:
Age (in years)
$10-20$
$20-30$
$30-40$
$40-50$
$50-60$
$60-70$
Number of patiets
$90$
$40$
$60$
$20$
$120$
$30$
Draw a histogram for the given data. Hint. Take $10$ small divisions $= 10$ patients.
View full question & answer
Question 95 Marks
The weights (in kg) of $30$ students of a class are- $39, 43, 32, 37, 29, 26, 31, 45, 46, 31, 37, 38, 30, 39, 36, 41, 35, 34, 41, 46, 39, 38,$ $36, 38, 40, 42, 33, 43, 44, 33$. Prepare a frequency distribution table using one class interval as $30-35$, in which $30$ is included and $35$ excluded. Using the above data. draw a histogram.
View full question & answer
Question 105 Marks
The marks obtained (out of 20) by 30 students of a class in a test are given below: $7, 10, 8, 16, 13, 14, 15, 11, 18, 11, 15, 10, 7, 14,$ $20, 19, 15, 16, 14, 20, 10, 11, 14, 17, 13, 12, 15, 14, 16, 17.$ Prepare a frequency distribution table for the above data using class intervals of equal width in which one class interval in $3-8$ (including $2$ and excluding $8$). From the frequency distribution table so obtained, draw a histogram.
View full question & answer
5 Marks Questions - Maths STD 8 Questions - Vidyadip