MCQ 11 Mark
Refer, the given graph and answer the following question: How many total push-ups were done throughout the week?

AnswerSumming up the push-ups for each day $= 25 + 15 + 25 + 5 + 10 + 0 + 20 = 100$
So, the total number of push-ups done throughout the week is $100.$
View full question & answer→MCQ 21 Mark
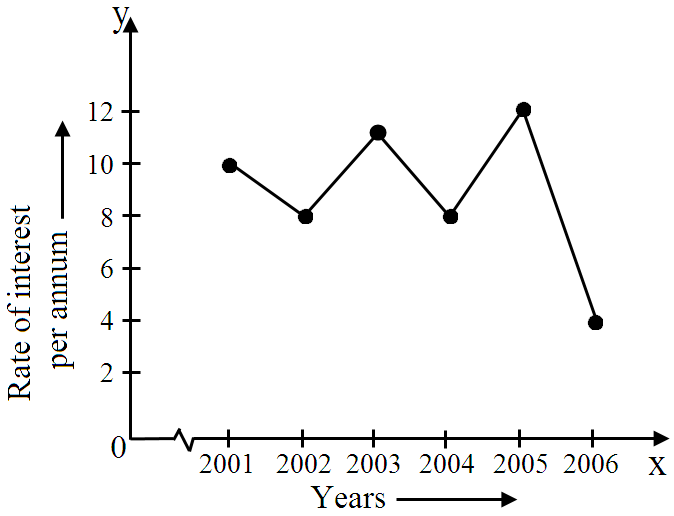
Read the graph and answer the related questions:

In which year was the rate of interest maximum?
- ✓
$2005$
- B
$2003$
- C
$2006$
- D
$2002$
AnswerCorrect option: A. $2005$
View full question & answer→MCQ 31 Mark
Read the circle graph and answer the related questions:

The sum of the number of students of class $III$ and class $IV$ is. View full question & answer→MCQ 41 Mark
Observe the following runs-over graph and answer the related questions:

In which over are the minimum runs scored?
MCQ 51 Mark
In which quadrant does the point $Q(-2, -6)$ lie?
View full question & answer→MCQ 61 Mark
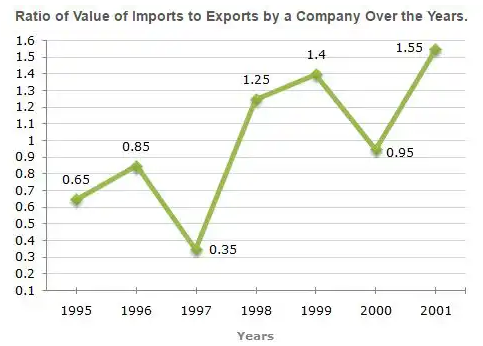
If the imports of the company in $1996$ was Rs. $272$ crores, the exports from the company in $1996$ was?
- A
Rs. $370$ crores
- ✓
Rs. $320$ crores
- C
Rs. $280$ crores
- D
Rs. $275$ crores
AnswerCorrect option: B. Rs. $320$ crores
Ratio of imports to exports in the year $1996 = 0.85.$
Let the exports in $1996 =$ Rs. x crores.
Then, $\frac{272}{\text{x}}=0.85$
$\Rightarrow\text{x}=\frac{272}{0.85}=320$
$\therefore$ Exports in $1996 =$ Rs. $320$ crores.
View full question & answer→MCQ 71 Mark
$..........$ is a type of bar diagram, where the class intervals are shown on the hirizontal axis.
AnswerHistogram is a type of bar diagram, where the class intervals are shown on the horizontal axis.
View full question & answer→MCQ 81 Mark
Observe the following runs-over graph and answer the related questions:

What is the difference of runs scored in $IV$ and $V$ overs? View full question & answer→MCQ 91 Mark
Observe the following histogram and answer the related questions:

In which class intervals, is the number of students $200?$ - ✓
$5-10$
- B
$0-5$
- C
$20-25$
- D
$15-20$
AnswerCorrect option: A. $5-10$
$5-10 \rightarrow 200$
View full question & answer→MCQ 101 Mark
Read the circle graph and answer the related questions:
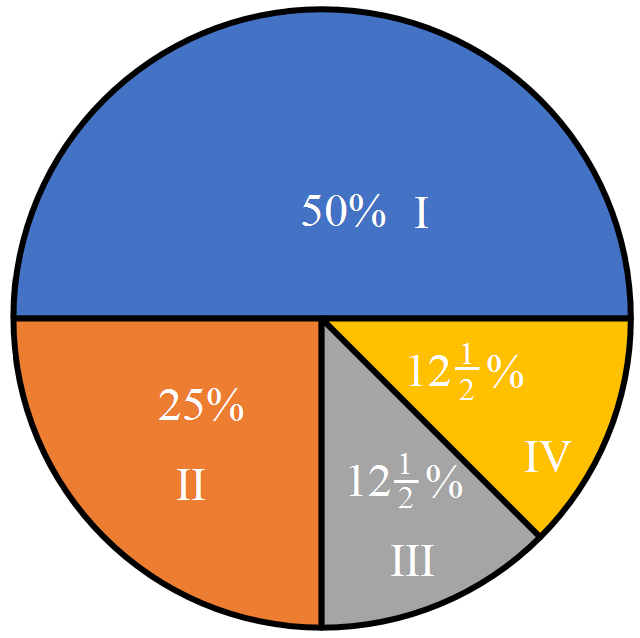
There are in all $1000$ students in a school. The number of students of class $I$ are. Answer$\frac{50}{100}\times=500$
View full question & answer→MCQ 111 Mark
How many sets had more even than negative numbers?

AnswerSet $A$ and Set $C$ have more even numbers.
View full question & answer→MCQ 121 Mark
The line graph shows the number of students in each department of a school. What does the second number in the ordered pair $(9, 10)$ represent?
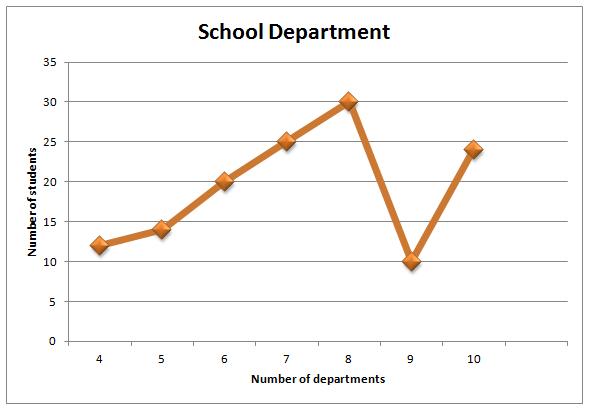
AnswerThe second number in the ordered pair $(9, 10)$ represent $10$ number of students in the department $9.$
View full question & answer→MCQ 131 Mark
The following line graph shows the yearly sales figures for a manufacturing company. What were the sales (in Rs. crores) in $2002$?
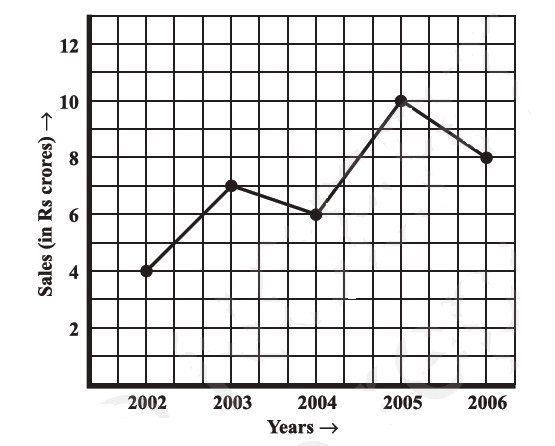
AnswerAs shown in the above graph, $y$ axis represents the sales(in crores) and $x$ axis represents the years.
So in the year $2002$ the sales were upto $4$ crore.
View full question & answer→MCQ 141 Mark
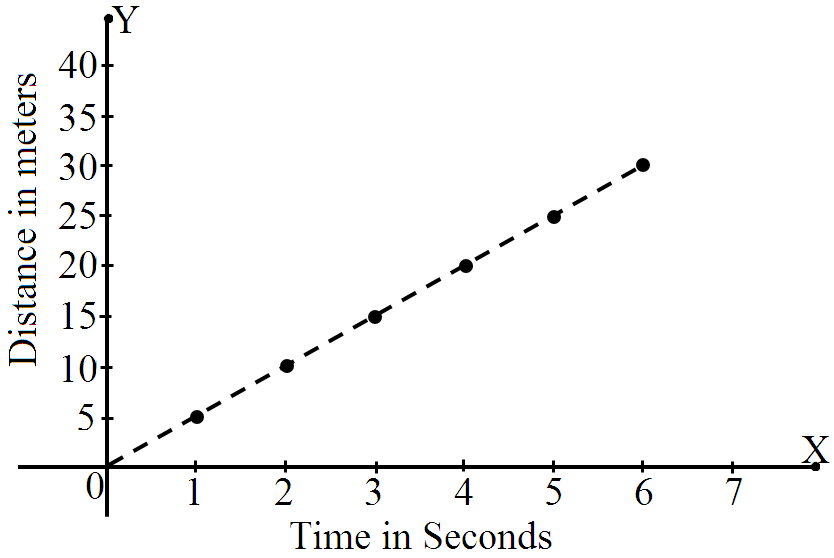
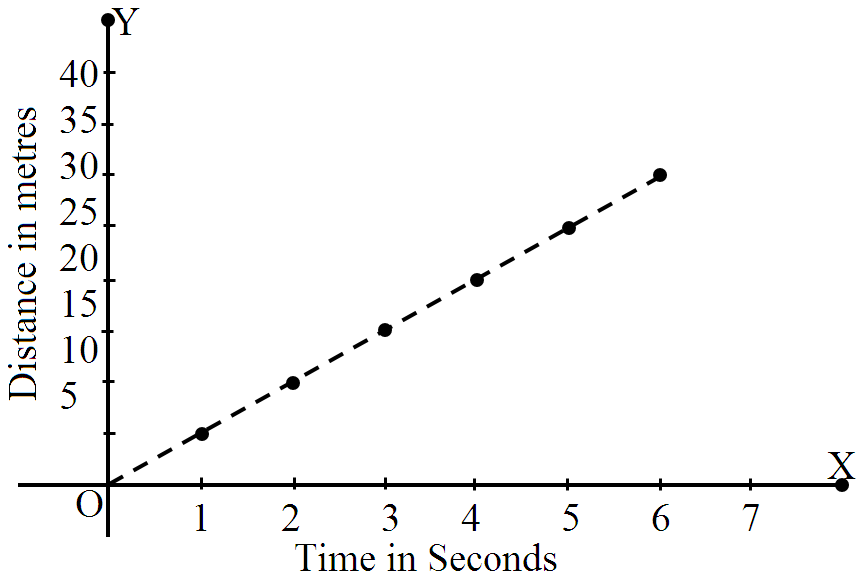
Find the time taken by a body to cover $25$ metres.
- A
$4$ seconds
- B
$6$ seconds
- C
$3$ seconds
- ✓
$5$ seconds
AnswerCorrect option: D. $5$ seconds
$5$ seconds
View full question & answer→MCQ 151 Mark
Read the circle graph and answer the related questions:

The minimum number of students in any class is:
- ✓
$125$
- B
$250$
- C
$500$
- D
$1000$
Answer$\frac{25}{2}\times\frac{1000}{100}=125$
View full question & answer→MCQ 161 Mark
Find the distance covered in $7$ seconds.

- A
$30\ m$
- B
$25\ m$
- ✓
$35\ m$
- D
$20\ m$
AnswerCorrect option: C. $35\ m$
$35\ m$
View full question & answer→MCQ 171 Mark
With the help of which of the following will you describe the position of a pen on a table?
AnswerCoordinate geometry is used to describe the position of an object lying in a plane.
View full question & answer→MCQ 181 Mark
Find the distance covered in $4$ seconds.

- ✓
$20\ m$
- B
$15\ m$
- C
$5\ m$
- D
$10\ m$
AnswerCorrect option: A. $20\ m$
$20\ m$
View full question & answer→MCQ 191 Mark
Observe the following runs-over graph and answer the related questions:

In which year was the rate of interest minimum?
- ✓
$2006$
- B
$2004$
- C
$2001$
- D
$2005$
AnswerCorrect option: A. $2006$
$2006 \rightarrow 4$
View full question & answer→MCQ 201 Mark
In a bar chart, the $..........$ are represented by the heights of the bars.
AnswerIn a bar chart, the frequencies are represented by the heights of the bars.
View full question & answer→MCQ 211 Mark
The point $(3, 2)$ is nearer to:
AnswerCorrect option: A. $X-$axis
The point $(3, 2)$ is nearer to $x-$ axis. View full question & answer→MCQ 221 Mark
Observe the following bar graph and answer the related questions:

On which head, is the expenditure maximum?
AnswerThe length of the bar corresponding to the head ‘salary of employees’ is maximum.
View full question & answer→MCQ 231 Mark
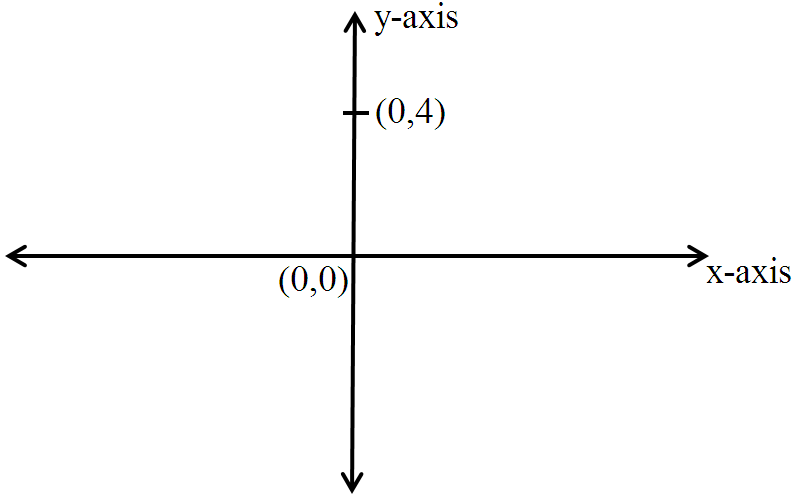
The point $(0, 4)$ lies on which of the following:
AnswerCorrect option: B. $Y-$axis
Point $(0, 4)$ lies on $y$ -axis, because its of the form $(0, y)$ where $x = 0.$
View full question & answer→MCQ 241 Mark
Read the circle graph and answer the related questions.

The number of students of class II is:
Answer$\frac{25}{100}\times1000=250$
View full question & answer→MCQ 251 Mark
A line graph which is a whole unbroken line is called a:
- ✓
- B
Pie$-$chart
- C
- D
Bar$-$graph
View full question & answer→MCQ 261 Mark
Observe the following temperature time graph and answer the related questions:

What are the coordinates of a point whose $x-$coordinate is $1$ and $y-$coordinate isO? - ✓
$(1, 0)$
- B
$(0, 0)$
- C
$(0, 1)$
- D
$(1, 1)$
AnswerCorrect option: A. $(1, 0)$
$(1, 0)$
View full question & answer→MCQ 271 Mark
The frequency curve shows the number of students ages $11$ through $17$ in Chennai city that have mobile phones. Refer to the frequency curve below to answer each question. How many mobile phones do $13$ year-old have? 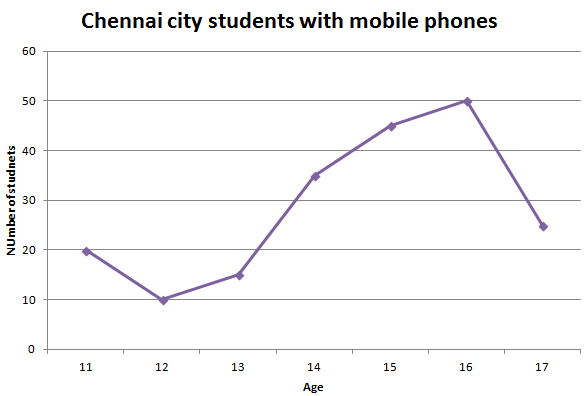
Answer$13$ year-old have $15$ mobile phones as shown in the graph.
View full question & answer→MCQ 281 Mark
Name the graph which is used to represent data in discrete manner?
AnswerThe bar graph is used to represent data in a discrete manner. An example is shown above.
View full question & answer→MCQ 291 Mark
Below is the data of the number of men and women in a village for different years. Now based on this data answer the following $MCQ$s with the correct option.

When is the population of men, the minimum? - A
$2010$
- B
$2015$
- C
$2020$
- ✓
$2005$
AnswerCorrect option: D. $2005$
In $2005$, there were only $500$ men in the village.
View full question & answer→MCQ 301 Mark
Observe the following temperature time graph and answer the related questions:

The coordinates of the origin are.
- ✓
$(0, 0)$
- B
$(1, 0)$
- C
$(0, 1)$
- D
$(1, 1)$
AnswerCorrect option: A. $(0, 0)$
$(0, 0)$
View full question & answer→MCQ 311 Mark
The point $(-2, -2)$ is:
AnswerCorrect option: A. Equidistant from $x-$axis and $y-$axis.
Equidistant from $x-$axis and $y-$axis.
View full question & answer→MCQ 321 Mark
A $..........$ is a bar graph that shows data in intervals.
- A
Bar$-$graph
- B
Pie$-$chart
- ✓
- D
View full question & answer→MCQ 331 Mark
The point $(4, 0)$ lies on which of the following?
AnswerCorrect option: A. $X-$axis
$X-$axis
View full question & answer→MCQ 341 Mark
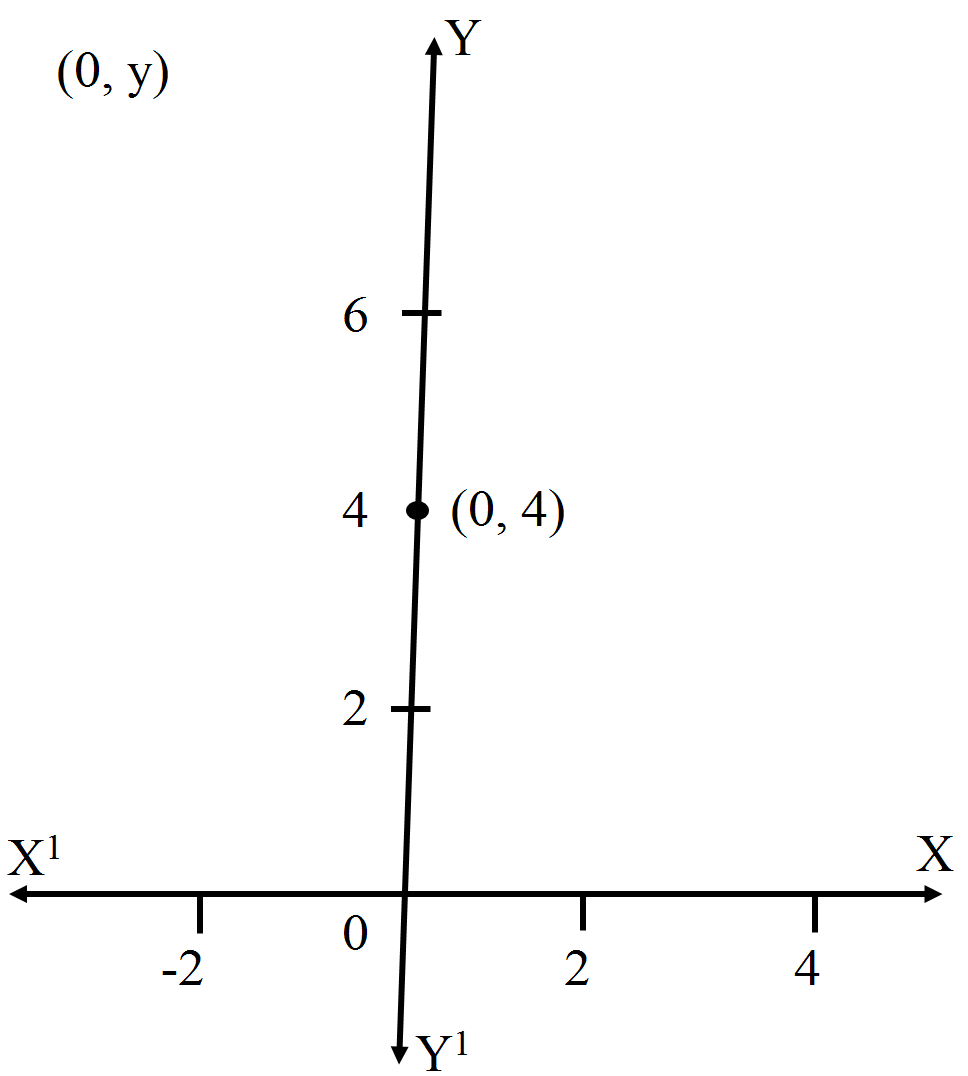
$(O, Y)$ are the co-ordinates of a point lying on which of the following?
AnswerCorrect option: B. $X-$axis
$(0, y)$ are the co-ordinates of a point lying on $y$ axis because points on $y-$axis have $x-$coordinate $0.$
View full question & answer→MCQ 351 Mark
Read the graph and answer the related questions:

Find the rise in the number of labourers from $2001$ to $2004.$ Answer$2001 \rightarrow 200$
$2004 \rightarrow 600$
$600 - 200 = 400$
View full question & answer→MCQ 361 Mark
Which of the following point will lie on $y-$axis'?
- A
$(8, 9)$
- ✓
$(0, 6)$
- C
$(6, 0)$
- D
$(-4, -5)$
AnswerCorrect option: B. $(0, 6)$
In $(0, 6)$, the $x-$coordinate is zero and $y-$coordinate is $6$. So $(0, 6)$ will lie on $y-$axis.
View full question & answer→MCQ 371 Mark
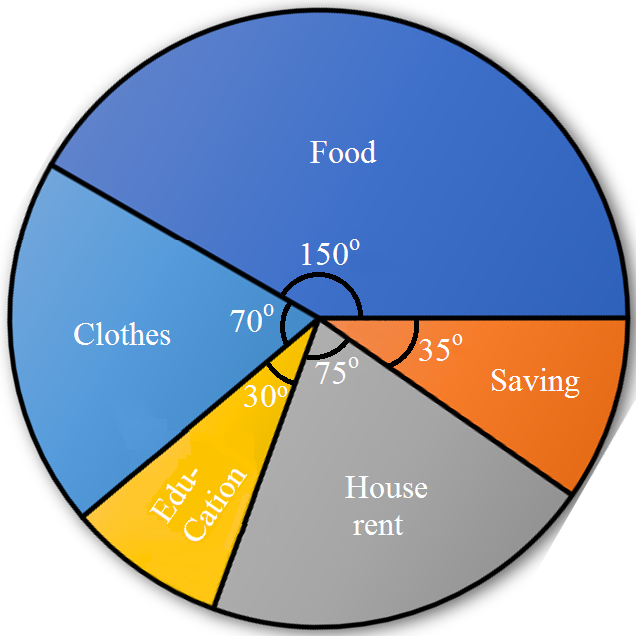
Observe the following circle-graph and answer the related questions:

What is the sum of the expenditures on food and education if the budget of the family is Rs. $10800?$ - A
Rs. $5000$
- B
Rs. $8000$
- ✓
Rs. $5400$
- D
Rs. $6000$
AnswerCorrect option: C. Rs. $5400$
$150+30=180$
$\frac{180}{360}\times10800=5400$
View full question & answer→MCQ 381 Mark
Rectangle bars touching each other in which graph $...........$
AnswerRectangle bars touching each other in histogram graph,
View full question & answer→MCQ 391 Mark
Find the coordinates of the point $D$ from the graph.
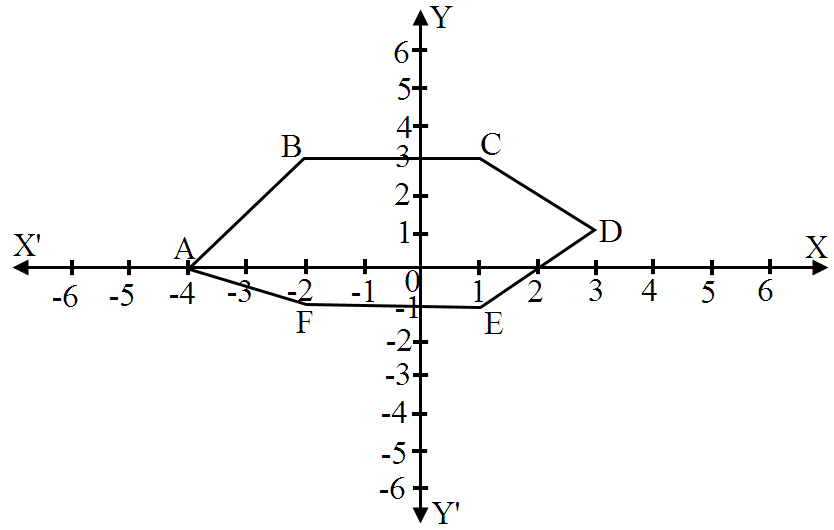
- A
$(0, -4)$
- B
$(-4, 5)$
- ✓
$(3, 1)$
- D
AnswerCorrect option: C. $(3, 1)$
$(3, 1)$
View full question & answer→MCQ 401 Mark
Find the time taken by a body to cover $30$ metres.

- ✓
$6$ seconds
- B
$5$ seconds
- C
$4$ seconds
- D
$3$ seconds
AnswerCorrect option: A. $6$ seconds
$6$ seconds
View full question & answer→MCQ 411 Mark
Observe the following temperature time graph and answer the related questions:

What are the coordinates of a point whose x-coordinate is $3$ and $y-$coordinate is $4?$ - A
$(3, 3)$
- ✓
$(3, 4)$
- C
$(4, 3)$
- D
$(4, 3)$
AnswerCorrect option: B. $(3, 4)$
$(3, 4)$
View full question & answer→MCQ 421 Mark
The point $(3, 4)$ is at a distance of:
AnswerCorrect option: C. $4$ from the $x$ axis and $3$ from $y$ axis.
We know that, the $x-$coordinate is the distance of the point from $Y-$axis and that of $y-$coordinate is the distance from $X-$axis.
Hence, the point $(3, 4)$ is at a distance of $4$ from the $X-$axis and $3$ from $Y-$axis.
View full question & answer→MCQ 431 Mark
A graph that displays data that changes continuously over periods of time is called:
MCQ 441 Mark
Which of the points given is a point on the $X-$axis?
- ✓
$(5, 0)$
- B
$(0, 5)$
- C
$(5, 3)$
- D
$(3, 5)$
AnswerCorrect option: A. $(5, 0)$
$(5, 0)$
View full question & answer→MCQ 451 Mark
$..........$ represents data that changes continuously over period of time.
AnswerThe line graphs shows a change in data over time. A line graph is useful for displaying data or information that changes continuously over time. Another name for a line graph is a line chart.
View full question & answer→MCQ 461 Mark
Which of the following point will lie on $x-$axis?
- A
$(5, 9)$
- B
$(0, 4)$
- ✓
$(3, 0)$
- D
$(6, 3)$
AnswerCorrect option: C. $(3, 0)$
In $(3, 0)$ the $x-$coordinate $3$ and $y-$coordinate is zero. So $(3, 0)$ will lie on $x-$axis.
View full question & answer→MCQ 471 Mark
Observe the following temperature time graph and answer the related questions:

What is the rise in temperature from $11$ hours to $13$ hours? - ✓
$1^\circ F$
- B
$2^\circ F$
- C
$4^\circ F$
- D
$3^\circ F$
AnswerCorrect option: A. $1^\circ F$
$104 - 103 = 1$
View full question & answer→MCQ 481 Mark
Comparison of parts of a whole may be done by a:
AnswerThere are various ways to represent and compare the data. One of them is pie chart.
Pie chart is a pictorial representation of the data in which the whole is represented by a circle and the parts, by non$-$intersecting adjacent sectors.
Hence, comparison of parts of a whole may be done by a pie chart.
View full question & answer→MCQ 491 Mark
A graph showing two sets of data simultaneously is known as:
AnswerA graph showing two sets of data simultaneously is known as a double bar graph.
View full question & answer→MCQ 501 Mark
Refer the given graph and answer the following question: A survey was conducted in a class to see how many girls and boys like a particular ice cream flavour. Which flavour ice cream is preferred equally by both boys and girls?

AnswerSince, for peach flavour, the number of girls and boys are equal.
View full question & answer→MCQ 511 Mark
Read the graph and answer the related questions:
Rise in interest from $2004$ to $2005$ was. View full question & answer→MCQ 521 Mark
The points $(-3, 2)$ and $(2, -3)$ represent:
AnswerThe given statement the point is different points.
Because, both of the given points are not same points.
In the points $(3, 5),$
$i. 3 = x -$ coordinate
$ii. 5 = y-$ coordinate
In the points $(5, 3),$
$i. 5 = x-$ coordinate
$ii. 3 = y-$ coordinate
View full question & answer→MCQ 531 Mark
Read the graph and answer the related questions:
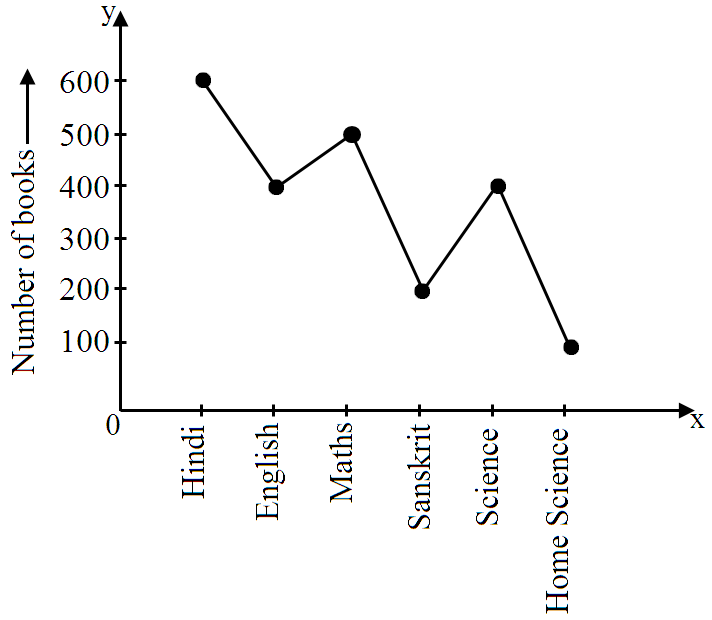
$500$ books are of which subject? View full question & answer→MCQ 541 Mark
The following graph shows the temperature forecast $\&$ the actual temperature for each day of a week. On the basis of the graph, answer the following questions.
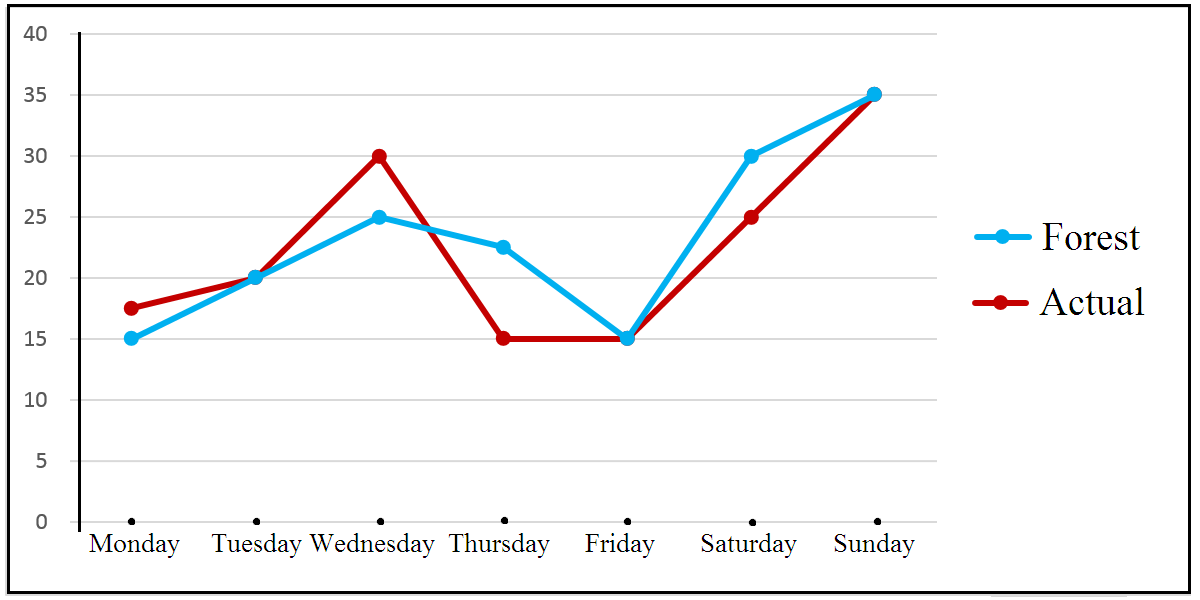
On which days did the actual temperature differ the most from the forecast temperature? View full question & answer→MCQ 551 Mark
On which axis does the point $(5, 0)$ lie?
AnswerCorrect option: C. $X-$axis
$X-$axis
View full question & answer→MCQ 561 Mark
Read the graph and answer the related questions:

How many students appeared in the year $2000?$ View full question & answer→MCQ 571 Mark
Observe the following histogram and answer the related questions:

The sum of the number of students in the class intervals $10-15$ and $20-25$ is: Answer$10-15 \rightarrow 300$
$20-25 \rightarrow 500$
$300 + 500 = 800$
View full question & answer→MCQ 581 Mark
In which quadrant does the point $P (-5, -1)$ lie?
View full question & answer→MCQ 591 Mark
Observe the following circle-graph and answer the related questions:

What is the difference of expenditures on clothes and education if the budget of the family is Rs. $10800?$ - ✓
Rs. $1200$
- B
Rs. $1000$
- C
Rs. $800$
- D
Rs. $1500$
AnswerCorrect option: A. Rs. $1200$
$70-30=40$
$\frac{40}{360}\times10800=1200$
View full question & answer→MCQ 601 Mark
The point $(-2, 5)$ is nearer to:
AnswerCorrect option: A. $X-$axis
$X-$axis
View full question & answer→MCQ 611 Mark
Data was collected on a student’s typing rate and graph was drawn as shown below. Approximately how many words had this student typed in $30$ seconds?
AnswerObserving the graph, we see that the graph intersects the line $x = 30$ just below the point $(30, 30)$, which is the intersection of the lines* $= 30$ and $y- 30.$
Since, the $X-$axis represents the time (in seconds) and the $Y-$axis represents the number of words typed, therefore we conclude that the students had typed approximately $28$ words In $30s.$
View full question & answer→MCQ 621 Mark
Read the graph and answer the related questions:

In which year did $50$ students appear? - A
$1998$
- B
$2001$
- C
$1997$
- ✓
$1996$
AnswerCorrect option: D. $1996$
$50 \rightarrow 1996$
View full question & answer→MCQ 631 Mark
The given line graph shows the growth rate of a kitten During which $2$ month period the kittens weight increased the most: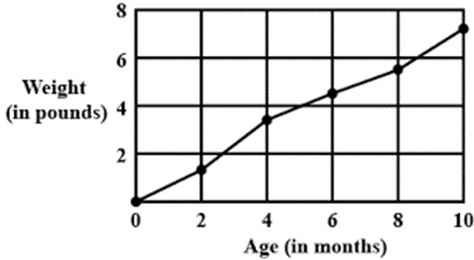
- A
$0$ to $2$ months
- ✓
$2$ to $4$ months
- C
$4$ to $6$ months
- D
$6$ to $8$ months
AnswerCorrect option: B. $2$ to $4$ months
The line graph shown is steepest from the period of $2$ months to $4$ months showing that the growth is maximum.
View full question & answer→MCQ 641 Mark
The point $(-2, -2)$ is:
AnswerCorrect option: D. Equidistant from $x-$axis and $y-$axis.
Equidistant from $x-$axis and $y-$axis.
View full question & answer→MCQ 651 Mark
Here is the list of temperature in $^\circ C$ for $10$ days. $-9, -11, 0, 5, 3, -5, 7, 1, 0, 3$ What is the range of the data'?
- A
$7^\circ C$
- ✓
$18^\circ C$
- C
$0^\circ C$
- D
$-11^\circ C$
AnswerCorrect option: B. $18^\circ C$
Range of data = Maximum temperature- Minimum temperature $= 7 - (-11) = 18$
View full question & answer→MCQ 661 Mark
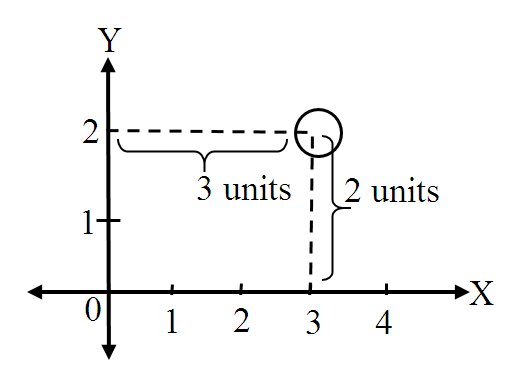
In the given graph the coordinates of point $x$ are:
- A
$(0, 2)$
- B
$(2, 3)$
- ✓
$(3, 2)$
- D
$(3, 0)$
AnswerCorrect option: C. $(3, 2)$
The foot of the perpendicular drawn from the indicated point on $X-$axis is at a distance of $3$ units from the origin.
The $x-$coordinate of the point is $3.$
Again, the perpendicular drawn from the given point on $Y-$axis meets the $Y-$axis at a point which is at a distance of $2$ units from origin.
The $y-$coordinate of the point is $2.$
Hence, the coordinates of the point are $(3, 2).$
View full question & answer→MCQ 671 Mark
Refer the given graph and answer the following question: In which year, was the number of cars manufactured by both the companies the highest?
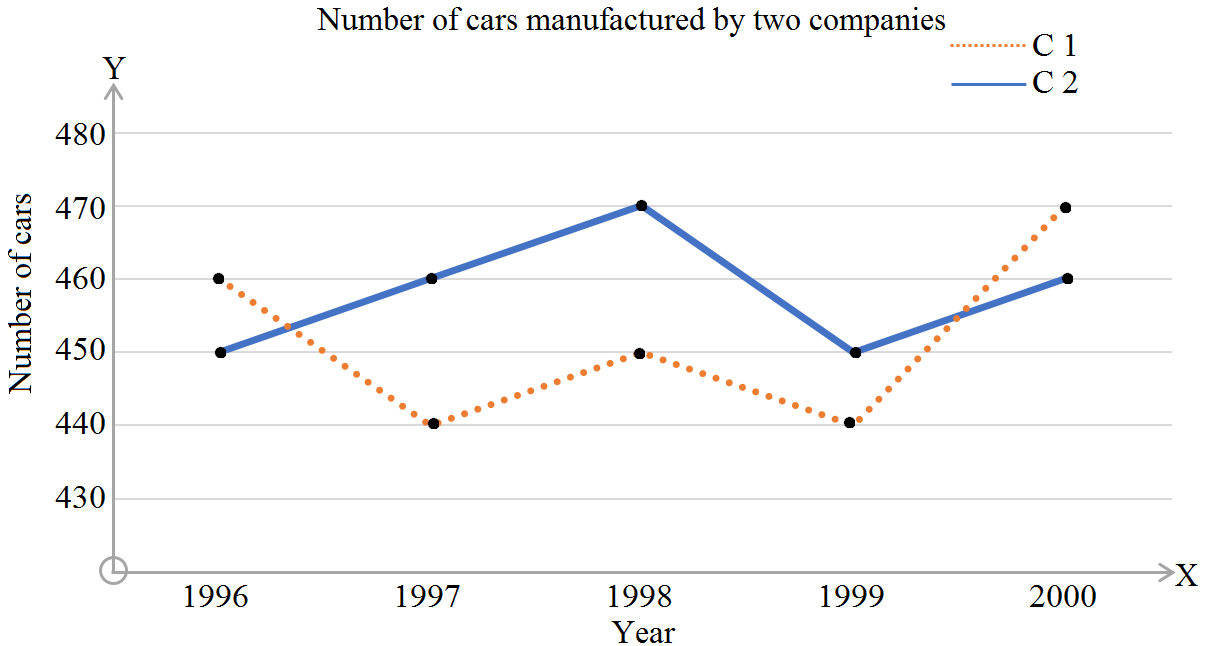
- A
$1997$
- B
$1998$
- C
$1999$
- ✓
$2000$
AnswerCorrect option: D. $2000$
For the year $1996$, total cars manufactured $= 450 + 460 = 910$
For the year $1997$, total cars manufactured $= 440 + 460 = 900$
For the year $1998$, total cars manufactured $= 450 + 470 = 920$
For the year $1999$, total cars manufactured $= 440 + 450 = 890$
For the year $2000$, total cars manufactured $= 460 + 470 = 930$
The highest is in the year $2000.$
View full question & answer→MCQ 681 Mark
Observe the following bar graph and answer the related questions:
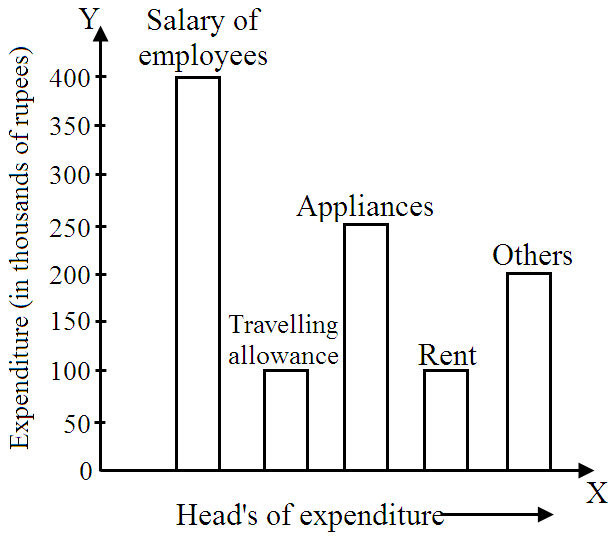
What is the sum of the expenditures (in thousands of rupees) on travelling allowance and rent?
MCQ 691 Mark
Read the graph and answer the related questions:

In which year was the number of labourers maximum?
- A
$2001$
- B
$2002$
- C
$2003$
- ✓
$2004$
AnswerCorrect option: D. $2004$
View full question & answer→MCQ 701 Mark
Observe the following velocity-time graph and answer the related questions:
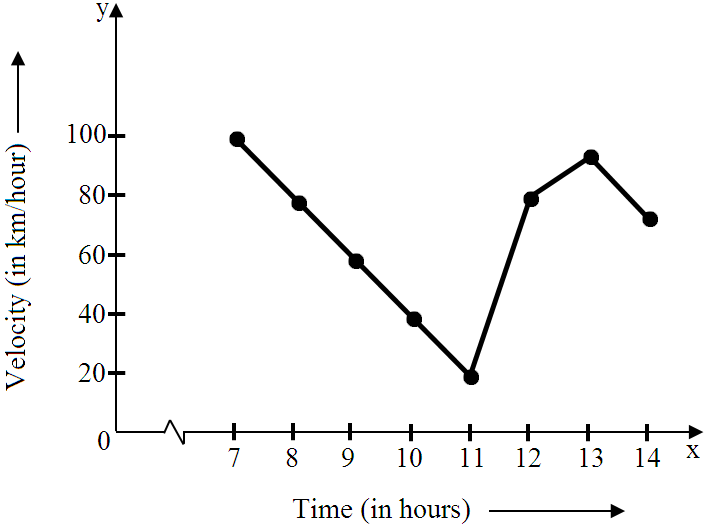
At what time is the velocity minimum?
Answer$11 \rightarrow 20$
View full question & answer→MCQ 711 Mark
Which is a two dimensional graph?
AnswerA histogram is a two dimensional graph. Shown in the figure above is a histogram.
View full question & answer→MCQ 721 Mark
Observe the following runs-over graph and answer the related questions:

$3$ runs are scored in which overs? - ✓
$II$ and $X$
- B
$I$ and $V$
- C
$VII$ and $VIII$
- D
$X$ and $XII$
AnswerCorrect option: A. $II$ and $X$
$II \rightarrow 3, X \rightarrow 3$
View full question & answer→MCQ 731 Mark
On which axis does the point $(-1, 0)$ lie?
AnswerCorrect option: A. $X-$axis
$X-$axis
View full question & answer→MCQ 741 Mark
In the given graph the letter that indicates the point $(0, 3)$ is:
AnswerThe letter that indicates the point $(0, 3)$ is $R$ as it lies on the $Y-$axis at a distance of $3$ units from the origin.
The coordinates of the point $P$ and Sare $(3, 0)$ and $(3, 3)$, respectively.
View full question & answer→MCQ 751 Mark
The point $(-5, 6)$ is nearer it:
AnswerCorrect option: B. $Y-$oxis
Given point is $(-5, 6) x$ coordinate $= -5$ and $y$ coordinate $= 6$ hence, distance of the point from $x$ axis $= 6$ units and distance of the point from $y$ axis $= 5$ units.
Thus the point is nearer to $y$ axis.
View full question & answer→MCQ 761 Mark
Which of the following are types of graph which include bars?
AnswerCorrect option: D. $(A)$ and $(C)$ both
A bar graph is a graphical representation of data using bars of different heights.
Histogram is also a graphical representation of data using bars of different heights but it groups the numbers into ranges.
View full question & answer→MCQ 771 Mark
If we join $(-3, 2), (-3, -3)$ and $(-3, 4)$, then we obtain:
- A
- ✓
Straight-line without passing through origin.
- C
Straight-line passing through origin.
- D
AnswerCorrect option: B. Straight-line without passing through origin.
Straight-line without passing through origin.
View full question & answer→MCQ 781 Mark
Find the coordinates of the point $B$ from the graph.
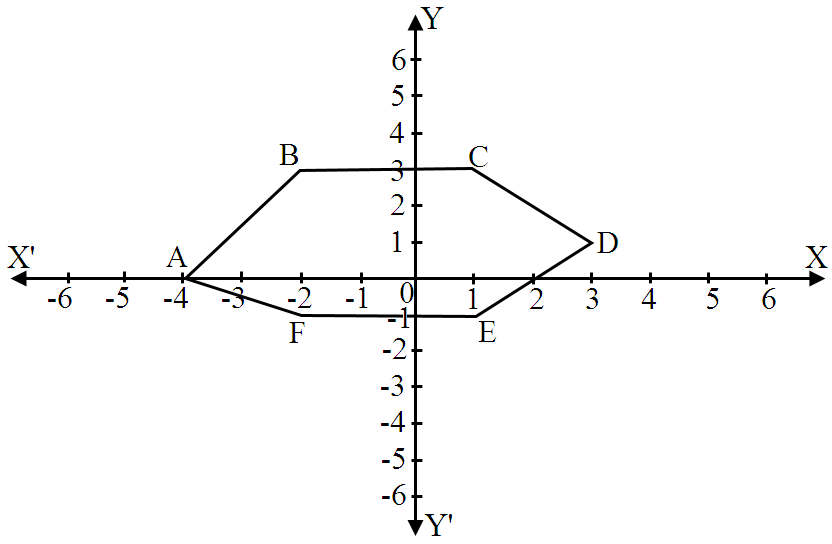
- ✓
$(-2, 3)$
- B
$(0, -4)$
- C
$(-4, 5)$
- D
AnswerCorrect option: A. $(-2, 3)$
$(-2, 3)$
View full question & answer→MCQ 791 Mark
If we join $(-3, 2), (-3, -3)$ and $(-3, 4),$ then we obtain:
- ✓
Straight-line without passing through origin.
- B
- C
Straight-line passing through origin.
- D
AnswerCorrect option: A. Straight-line without passing through origin.
Straight-line without passing through origin.
View full question & answer→MCQ 801 Mark
Observe the following temperature time graph and answer the related questions:

$103^\circ F$ temperature is at time. - ✓
$11$ hours
- B
$13$ hours
- C
$15$ hours
- D
$21$ hours
AnswerCorrect option: A. $11$ hours
$103^\circ F \rightarrow 11 hours$
View full question & answer→MCQ 811 Mark
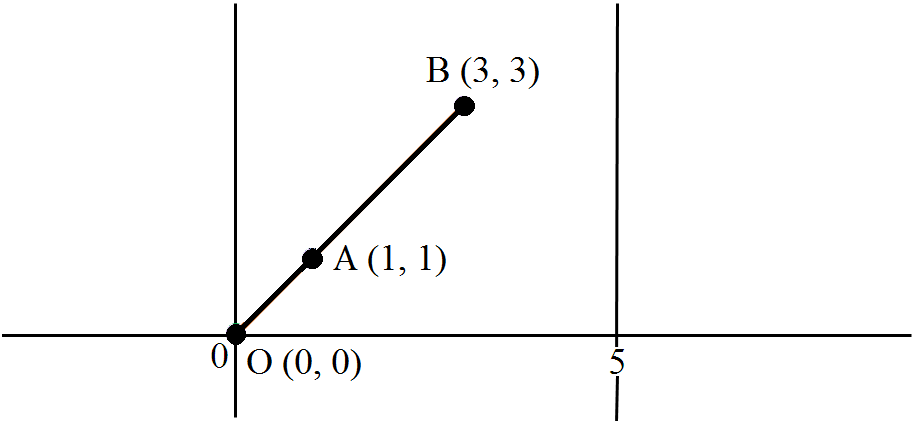
By joining $(-1, -1), (0, 0)$ and $(3, 3)$ represent:
- A
- B
- ✓
A straight line passing through origin.
- D
A straight line not passing through origin.
AnswerCorrect option: C. A straight line passing through origin.
Given: the three points $(1, 1), (0, 0)$ and $(3, 3)$ To find:
What is represented by the joining of the points given Refer to the attachment.
The origin $O (0, 0), A (1, 1)$ and $B (3, 3)$ make a straight line passing through the origin. If we want to find the equation of the straight line that passes through the given points:
$\frac{\text{y}-0}{0-1}=\frac{\text{x}-0}{0-1}$
or, $\frac{\text{y}}{(-1)}=\frac{\text{x}}{(-1)}$
or, $\text{y}=\text{x}$
This is the required line.
View full question & answer→MCQ 821 Mark
By joining $(-3, 2), (-3, -3)$ and $(-3, 4)$, which of the following is obtained?
- A
- ✓
A straight line not passing through origin.
- C
A straight line passing through origin.
- D
AnswerCorrect option: B. A straight line not passing through origin.
View full question & answer→MCQ 831 Mark
Observe the diagram, given below and find the correct answer to the following $MCQ$s.

Which team has the lowest score? - ✓
Team $3$
- B
Team $1$
- C
Team $4$
- D
Team $2$
AnswerCorrect option: A. Team $3$
Team $3$ has the lowest score with $10.9\%.$
View full question & answer→MCQ 841 Mark
Read the graph and answer the related questions:

In which year did the maximum number of students appear?
- ✓
$2002$
- B
$2000$
- C
$2001$
- D
$1999$
AnswerCorrect option: A. $2002$
View full question & answer→MCQ 851 Mark
The following graph shows the temperature forecast & the actual temperature for each day of a week. On the basis of the graph, answer the following questions.

What was the minimum forecast temperature during the week?
- A
$35^\circ C$
- B
$25^\circ C$
- C
$30^\circ C$
- ✓
$15^\circ C$
AnswerCorrect option: D. $15^\circ C$
$15^\circ C$
View full question & answer→MCQ 861 Mark
The point $(-5, 2)$ is nearer to:
AnswerCorrect option: B. $X-$axis
$X-$axis
View full question & answer→MCQ 871 Mark
The following line graph shows the yearly sales figures for a manufacturing company. What were the sales in $2005?$

AnswerFrom the graph the value on $y−$axis (denoting sales) for the year $2005$ is Rs. $10$ crore.
View full question & answer→MCQ 881 Mark
Observe the following temperature time graph and answer the related questions:

At what time(s) is the temperature minimum?
- ✓
$7$ hours and $21$ hours
- B
$9$ hours
- C
$11$ hours
- D
$13$ hours
AnswerCorrect option: A. $7$ hours and $21$ hours
$7, 21 \rightarrow 98^\circ F$
View full question & answer→MCQ 891 Mark
A is used to compare the parts of the whole.
AnswerA pie$-$graph is used to compare the parts of the whole.
View full question & answer→MCQ 901 Mark
On joining the points if we get a straight line, that graph is called.
AnswerA chart which displays information as a series of data points connected by straight line is known as line graph.
View full question & answer→MCQ 911 Mark
The point $(0, 0)$ lies at:
View full question & answer→MCQ 921 Mark
Observe the following runs-over graph and answer the related questions:
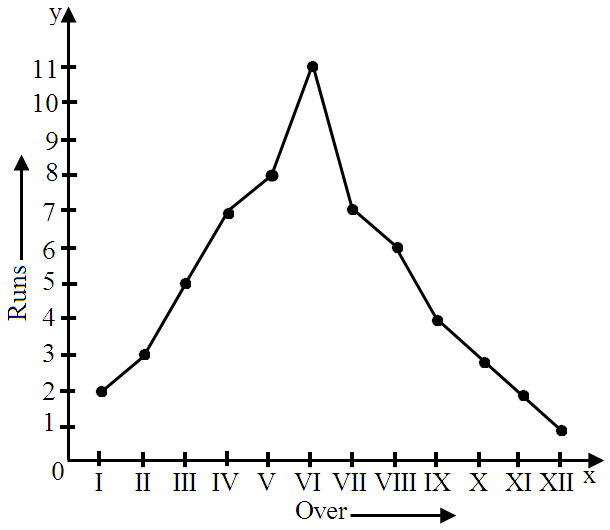
What is the sum of runs scored in $I$ and $XII$ overs? View full question & answer→MCQ 931 Mark
A point which lies on both the axes is:
- ✓
$(0, 0)$
- B
$(0, 1)$
- C
$(1, 0)$
- D
$(1, 1)$
AnswerCorrect option: A. $(0, 0)$
We know that, the axes are two mutually perpendicular lines intersecting each other at the point $(0, 0)$ also known as the origin.
Hence, the point which lies on both the axes is $(0, 0).$
View full question & answer→MCQ 941 Mark
Below is the data of the number of men and women in a village for different years. Now based on this data answer the following $MCQ$s with the correct option.
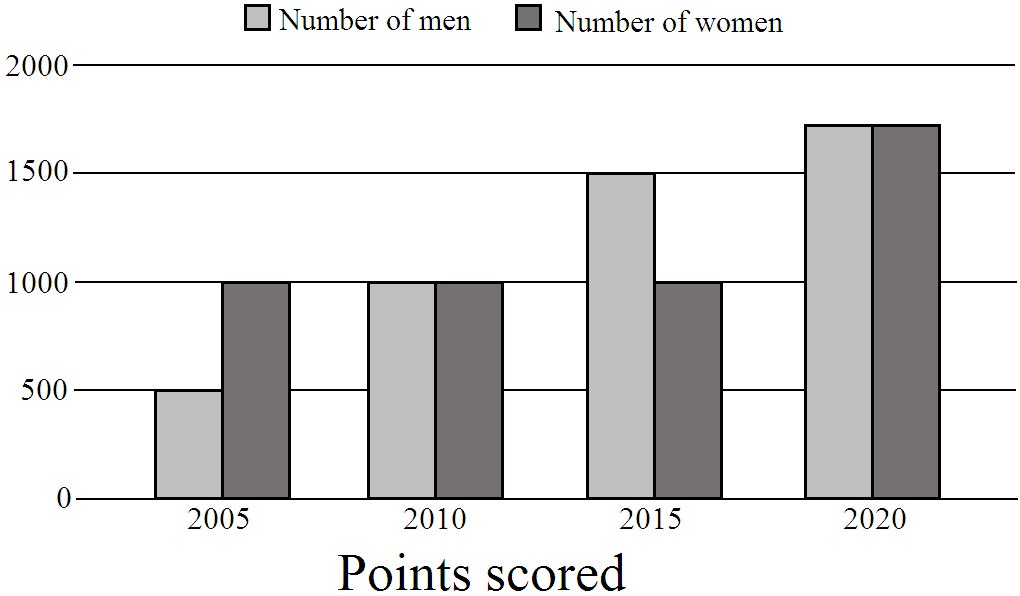
In which year population of men is more than women? - A
$2005$
- B
$2010$
- C
$2020$
- ✓
$2015$
AnswerCorrect option: D. $2015$
$2015$
View full question & answer→MCQ 951 Mark
A $............$ is a bar graph that shows data in intervals.
- ✓
- B
Bar$-$graph
- C
Pie$-$chart
- D
View full question & answer→MCQ 961 Mark
Read the graph and answer the related questions:

The difference in the maximum and minimum rates of interest was.
MCQ 971 Mark
Observe the following temperature time graph and answer the related questions:

What is the difference of temperatures at $7$ hours and $21$ hours? - ✓
$0^\circ F$
- B
$1^\circ F$
- C
$2^\circ F$
- D
$3^\circ F$
AnswerCorrect option: A. $0^\circ F$
$98 - 98 = 0$
View full question & answer→MCQ 981 Mark
Read the graph and answer the related questions:

What was the difference of the number of labourers in the years $2002$ and $2003?$ Answer$2002 \rightarrow 300$
$2003 \rightarrow 500$
$500 - 300 = 200$
View full question & answer→MCQ 991 Mark
Find the coordinates of the point $C$ from the graph.

- ✓
$(1, 3)$
- B
$(-4, 5)$
- C
$(0, -4)$
- D
AnswerCorrect option: A. $(1, 3)$
$(1, 3)$
View full question & answer→MCQ 1001 Mark
Observe the following bar graph and answer the related questions:

On which two heads, is the expenditure same?
- A
Salary of employees and others.
- ✓
Travelling allowance and rent.
- C
- D
AnswerCorrect option: B. Travelling allowance and rent.
The lengths of the bars corresponding to the heads travelling allowance and rent are the same.
View full question & answer→MCQ 1011 Mark
Observe the following velocity-time graph and answer the related questions:

At what times are the velocities equal?
- ✓
$8$ and $12$
- B
$9$ and $11$
- C
$7$ and $12$
- D
$11$ and $13$
AnswerCorrect option: A. $8$ and $12$
$8 \rightarrow 80$
$12 \rightarrow 80$
View full question & answer→MCQ 1021 Mark
The line graph shows the monthly expenditure of Vasu family. The total expenditure over the first $3$ months is:

- A
Rs.$320$
- B
Rs.$600$
- C
Rs.$1100$
- ✓
Rs.$1400$
AnswerCorrect option: D. Rs.$1400$
In the graph, $1$ unit on y-axis $= Rs.100$
The monthly expenses of Basu family in the month of,
In January, the expenditure is marked upto $5$ units $= Rs.500$
In February, the expenditure is marked upto $6$ units $= Rs.600$
In March, the expenditure is marked upto $3$ units $= Rs.300$
$\therefore$ The total expenditure over the first $3$ months $= Rs.(500 + 600 + 300) = Rs.1400$
View full question & answer→MCQ 1031 Mark
Find the distance covered in $3$ seconds.
- ✓
$15\ m$
- B
$10\ m$
- C
$5\ m$
- D
$20\ m$
AnswerCorrect option: A. $15\ m$
$15\ m$
View full question & answer→MCQ 1041 Mark
The graph represents the relation between dependent variable and:
AnswerThe graph represents the relation between dependent variable and independent variable.
View full question & answer→MCQ 1051 Mark
Refer the given graph and answer the following question: A survey was conducted in a class to see how many girls and boys like a particular ice cream flavour. How many more girls like the chocolate flavour than the boys?
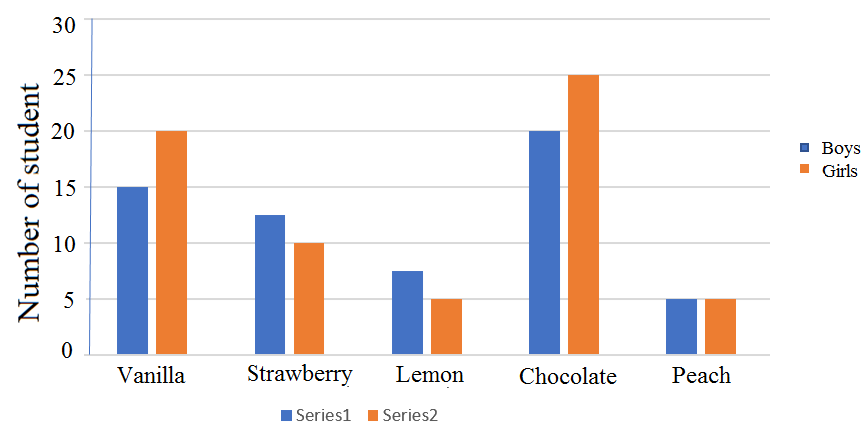
AnswerFor chocolate, number of girls $= 25$ and number of boys $= 20$
Difference $= 25 - 20 = 5$
View full question & answer→MCQ 1061 Mark
Observe the following temperature time graph and answer the related questions:

What is the fall in temperature from $13$ hours to $21$ hours? - A
$2^\circ F$
- B
$3^\circ F$
- C
$4^\circ F$
- ✓
View full question & answer→MCQ 1071 Mark
Read the graph and answer the related questions:

How many books are there in Sanskrit and Home Science taken together?
- A
$100$
- B
$200$
- ✓
$300$
- D
$400$
AnswerSanskrit $\rightarrow 200$
Home Science $\rightarrow 100$
$200 + 100 = 300$
View full question & answer→MCQ 1081 Mark
The width of the bars does not matter in _____ graph.
AnswerThe width of the bars does not matter in bar graph.
The width of the bars does not matter in graph.
View full question & answer→MCQ 1091 Mark
In which quadrant does the point $P (-4, 1)$ lie?
View full question & answer→MCQ 1101 Mark
Observe the following velocity-time graph and answer the related questions:

At what time is the velocity maximum?
Answer$7 \rightarrow 100$
View full question & answer→MCQ 1111 Mark
Which point lies of $y-$axis?
- A
$(-2, 0)$
- B
$(2, 0)$
- ✓
$(0, -2)$
- D
$(2, -2)$
AnswerCorrect option: C. $(0, -2)$
$(0, -2)$
View full question & answer→MCQ 1121 Mark
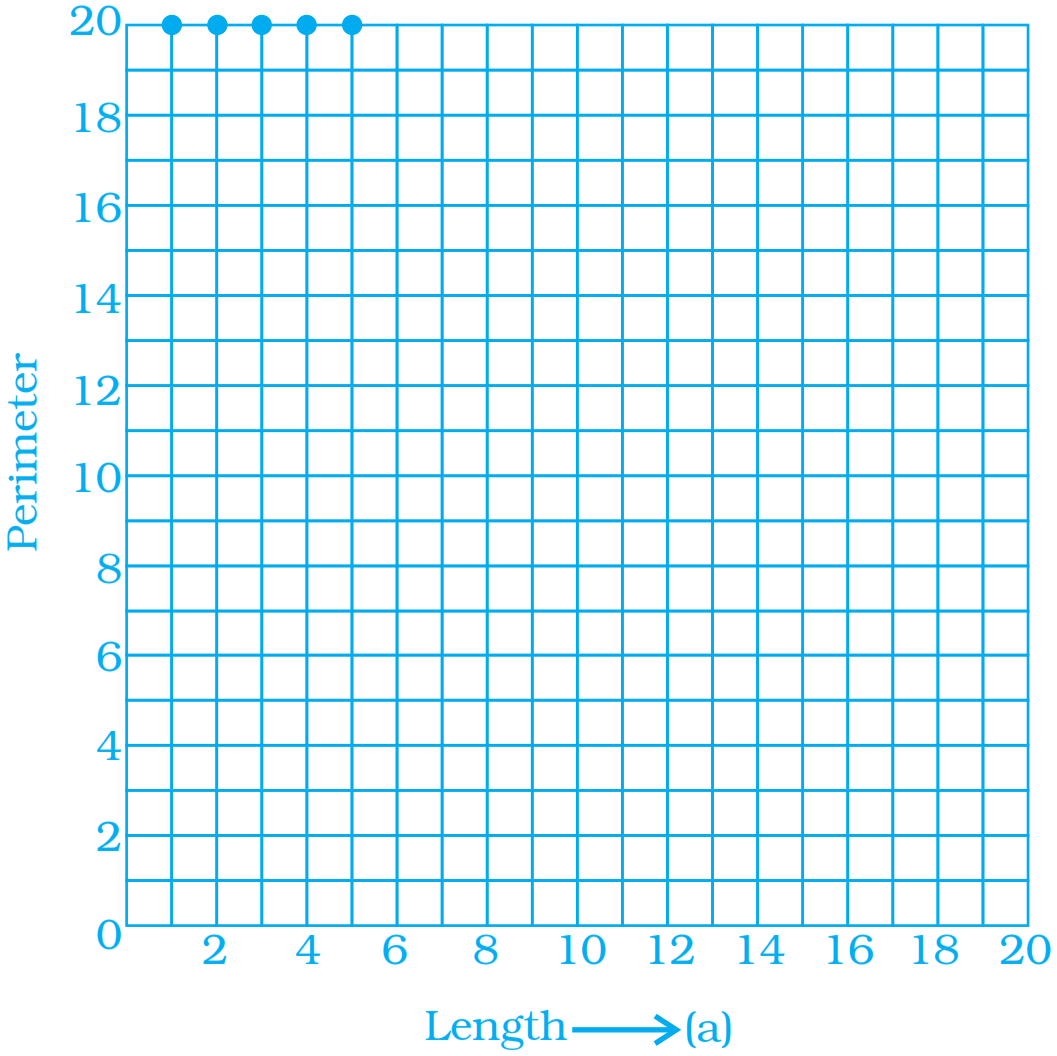
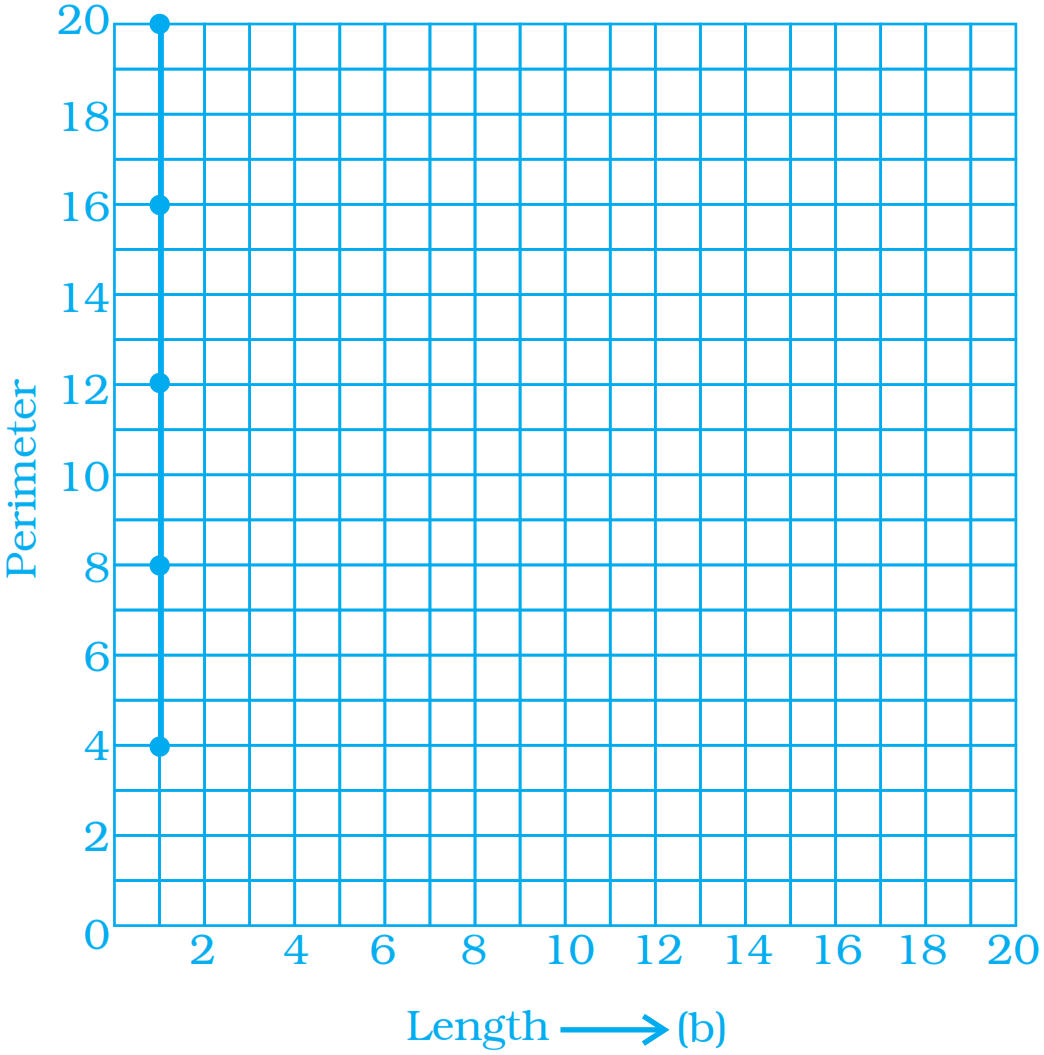
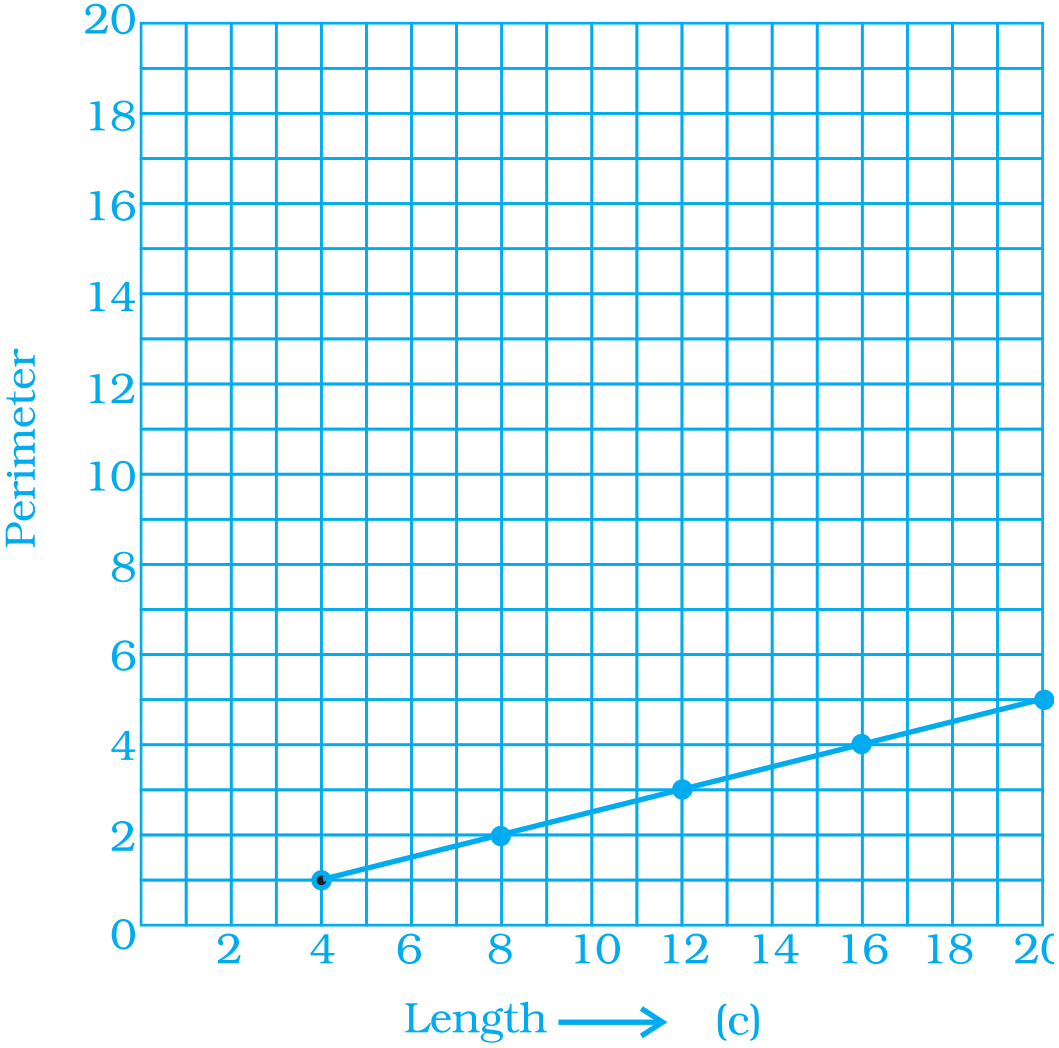
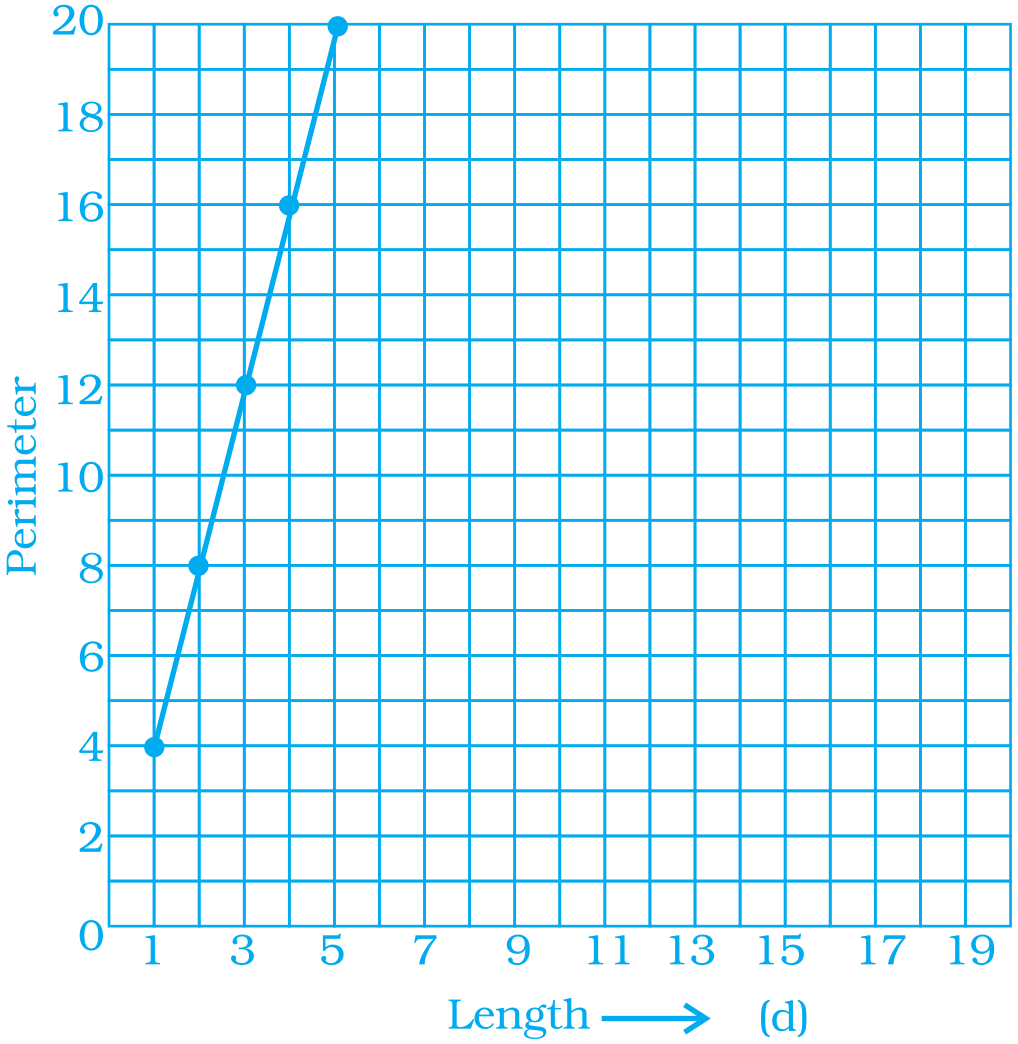
Which graphs of the following represent the table below?
| Length of Side of a Square |
$1$ |
$2$ |
$3$ |
$4$ |
$5$ |
| Perimeter |
$4$ |
$8$ |
$12$ |
$16$ |
$20$ |
Answer
Here, the lengths of sides of squares are represented on $X-$axis and their perimeters are represented on $Y-$axis.
The points are $(1, 4), (2, 8), (3, 12), (4, 16)$ and $(5, 20).$
Now, observing all the $4$ graphs carefully we see that these points lie on the graph $(d).$ View full question & answer→MCQ 1131 Mark
Below is the data of the number of men and women in a village for different years. Now based on this data answer the following $MCQ$s with the correct option.

In which year the population of women is the highest? - ✓
$2020$
- B
$2005$
- C
$2010$
- D
$2015$
AnswerCorrect option: A. $2020$
$2020$
View full question & answer→MCQ 1141 Mark
Which graph displays the data that changes continuously over periods of time?
AnswerLine graph displays the data that changes continuously over periods of time.
View full question & answer→MCQ 1151 Mark
Tick the corect answer in the following: In which of the following quadrants does the point $(-7, -1)$ lie?
AnswerCorrect option: D. A line parallel to the $x-$axis.
A line parallel to the $x-$axis.
View full question & answer→MCQ 1161 Mark
Pie chart is also known as:
AnswerPie chart is also known as circle graph.
View full question & answer→MCQ 1171 Mark
Observe the following temperature time graph and answer the related questions: 
What are the coordinates of a point whose $x-$coordinate is $0$ and $y-$coordinate is $1?$ - ✓
$(0, 1)$
- B
$(0, 0)$
- C
$(1, 0)$
- D
$(1, 1)$
AnswerCorrect option: A. $(0, 1)$
$(0, 1)$
View full question & answer→MCQ 1181 Mark
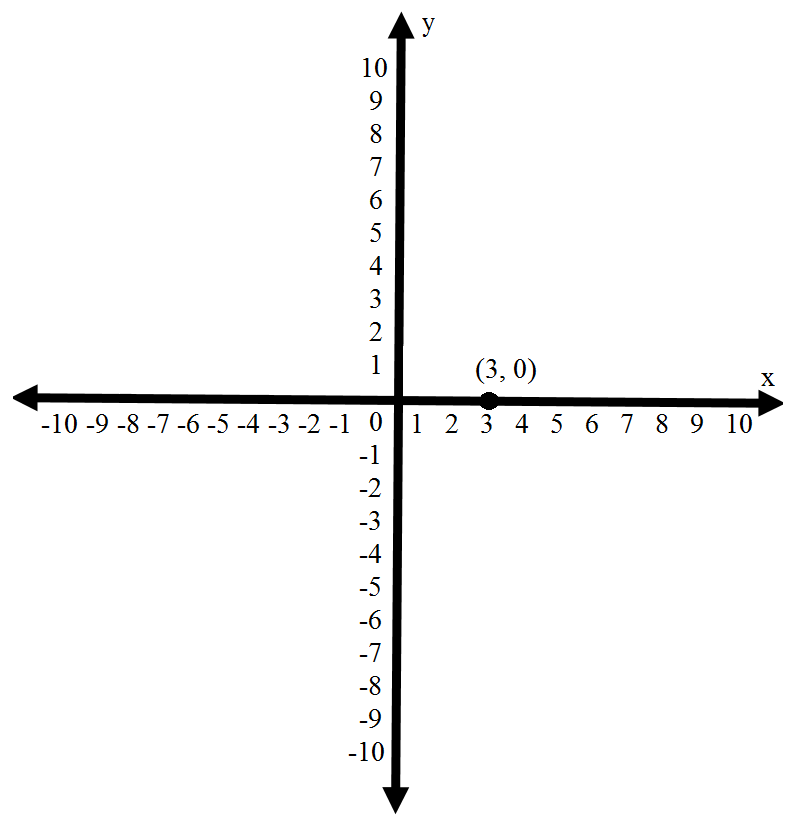
The point $(3, 0)$ lives on which of the following?
AnswerCorrect option: A. $X-$axis
Given, $(3, 0).$
Since the y-coordinate is $0$, the point clearly, lies on $x-$axis. Also, the x-coordinate $3$ being positive, the point lies on the positive $x-$axis.
View full question & answer→MCQ 1191 Mark
A $..........$ is the representation of data by using graphical symbols such as lines, bars, pie slices, histogram etc.
AnswerA graph is the representation of data by using graphical symbols such as lines, bars, pie slices, histogram etc.
Example: Line graph representing the temperature of $8$ days.

View full question & answer→MCQ 1201 Mark
The line graph shows the yearly sales figure for a manufacturing company. From the graph, what were the sales in $2006?$
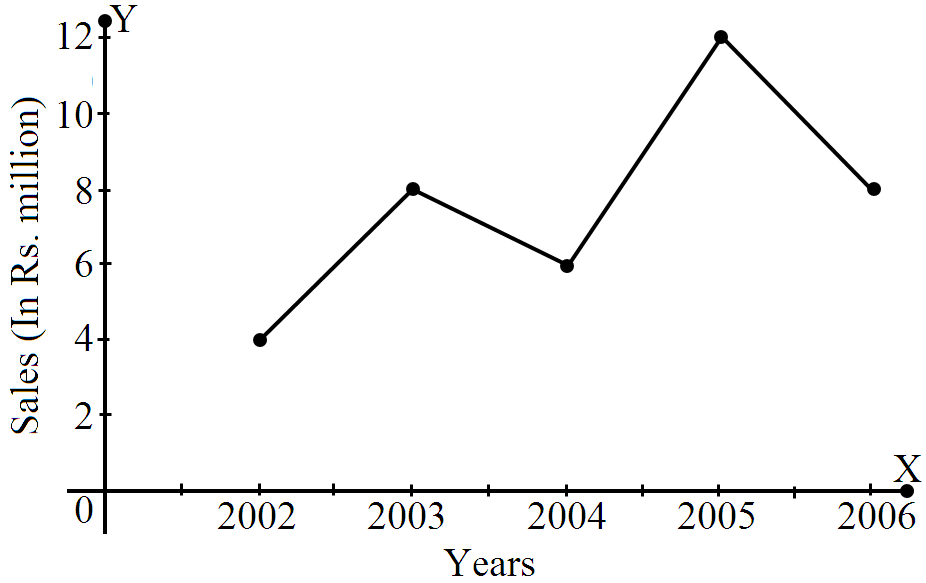
- ✓
Rs. $8$ millions
- B
Rs. $4$ millions
- C
Rs. $3$ millions
- D
Rs. $5$ millions
AnswerCorrect option: A. Rs. $8$ millions
Rs. $8$ millions
View full question & answer→MCQ 1211 Mark
Refer the given graph and answer the following question: On which day the number of push-ups done was $0"$

AnswerFrom the graph. we can see that number of push-ups done on Saturday are $0.$
View full question & answer→MCQ 1221 Mark
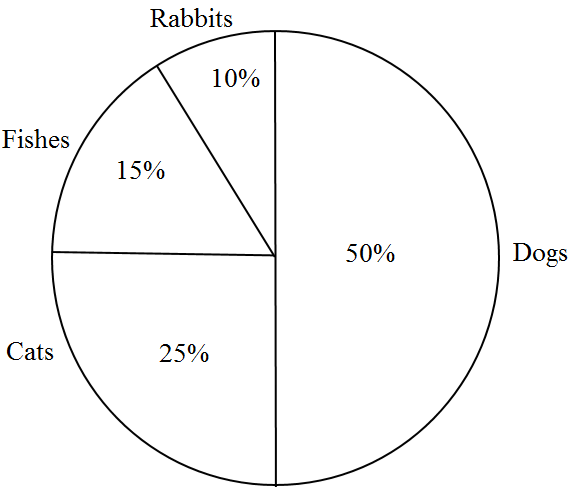
Refer the given pie chart and answer the following question: If $20$ people have rabbits as their pet. then how many people were surveyed?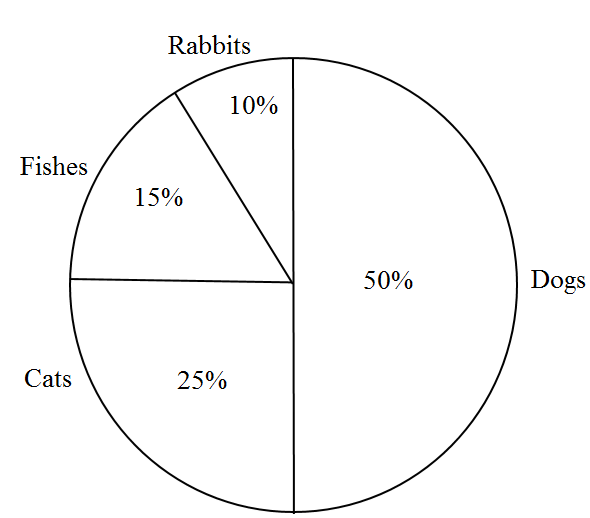
AnswerNumber of people who have rebbits as per $= 10\%$
This $10\%$ represents $20$ people.
So, $100\% =\frac{20\times100}{10}=200$ people
Therefore, $200$ people were surveyed.
View full question & answer→MCQ 1231 Mark
\Find the distance covered in $6$ seconds.

- ✓
$30\ m$
- B
$35\ m$
- C
$25\ m$
- D
AnswerCorrect option: A. $30\ m$
$30\ m$
View full question & answer→MCQ 1241 Mark
The point $(-5, 2)$ is nearer to:
AnswerCorrect option: B. $Y-$axis
$Y-$axis
View full question & answer→MCQ 1251 Mark
A line graph which is a whole unbroken line is called a:
- A
Pie$-$chart
- ✓
- C
- D
Bar$-$graph
View full question & answer→MCQ 1261 Mark
$(O, Y)$ are the co-ordinates of a point lying on which of the following?
AnswerCorrect option: B. $Y-$axis
$Y-$axis
View full question & answer→MCQ 1271 Mark
In the given figure the position of the book on the table may be given by:
- A
$(7, 3)$
- ✓
$(3, 7)$
- C
$(3, 3)$
- D
$(7, 7)$
AnswerCorrect option: B. $(3, 7)$
The book is at a distance of $3$ units from $Y-$axis and $7$ units from $X-$axis.
Hence, the position of the book on the table is given by $(3, 7).$
View full question & answer→MCQ 1281 Mark
Read the graph and answer the related questions:
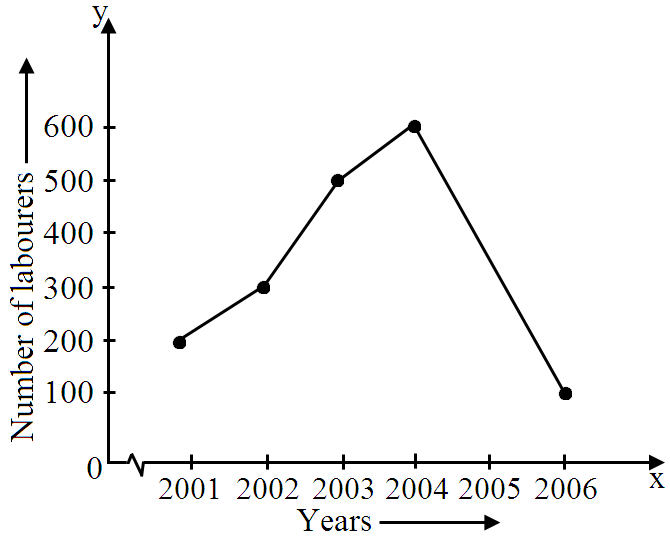
Find the sum of the number of labourers in the years $2004$ and $2006.$ Answer$2004 \rightarrow 600$
$2006 \rightarrow 100$
$600 + 100 = 700$
View full question & answer→MCQ 1291 Mark
Observe the diagram, given below and find the correct answer to the following $MCQ$s. 
Which team is coloured green? - A
Team $1$
- B
Team $4$
- C
Team $2$
- ✓
Team $3$
AnswerCorrect option: D. Team $3$
Team $3$
View full question & answer→MCQ 1301 Mark
Read the graph and answer the related questions:

What is the maximum number of students that appeared in any year?
MCQ 1311 Mark
Refer the given pie chart and answer the following question:
$200$ people are surveyed about the pet they own. Find the central angle for fishes.
- ✓
$54^\circ $
- B
$30^\circ$
- C
$50^\circ$
- D
$90^\circ$
AnswerCorrect option: A. $54^\circ $
Since $200$ people are surveyed and we need to find $15\%$ of $200$
So, $15\%$ of $200$ $=\frac{15}{100}\times200=30$
Therefore, $30$ people have fishes as their pets.
Now, fraction of people who have fishes $=\frac{30}{200}$
Central angle $=\frac{30}{200}\times360=54^\circ$
View full question & answer→MCQ 1321 Mark
Observe the diagram, given below and find the correct answer to the following $MCQ$s. 
Which team has the highest score? - A
Team $2$
- B
Team $3$
- ✓
Team $4$
- D
Team $1$
AnswerCorrect option: C. Team $4$
Team $4$ has the highest score with $34.5\%.$
View full question & answer→MCQ 1331 Mark
What is the approximate ratio of the sales of Medimix in $2007$ to the sales of Hamam in $2010?$
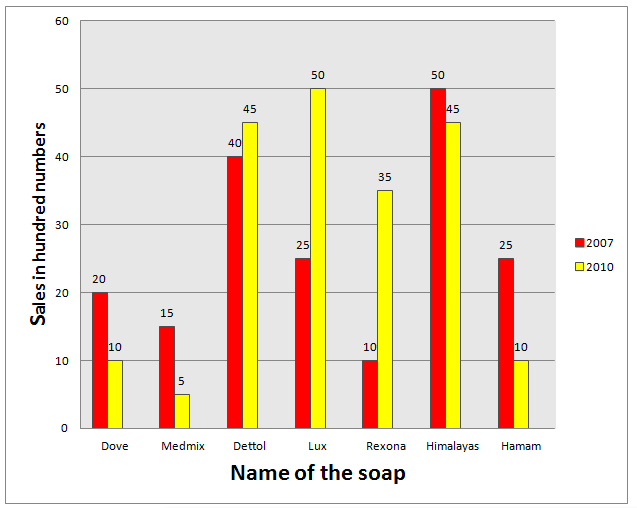
AnswerThe approximate ratio of the sales of Medimix in $2007$ to the sales of Hamam in $2010$ is:
Required ratio $ =\frac{10}{15}$
Ratio $= 3:2$
View full question & answer→MCQ 1341 Mark
Refer the given graph and answer the following question: How many more push-ups are needed to be done on Thursday so that 1t equals the number of push-ups on Wednesday?
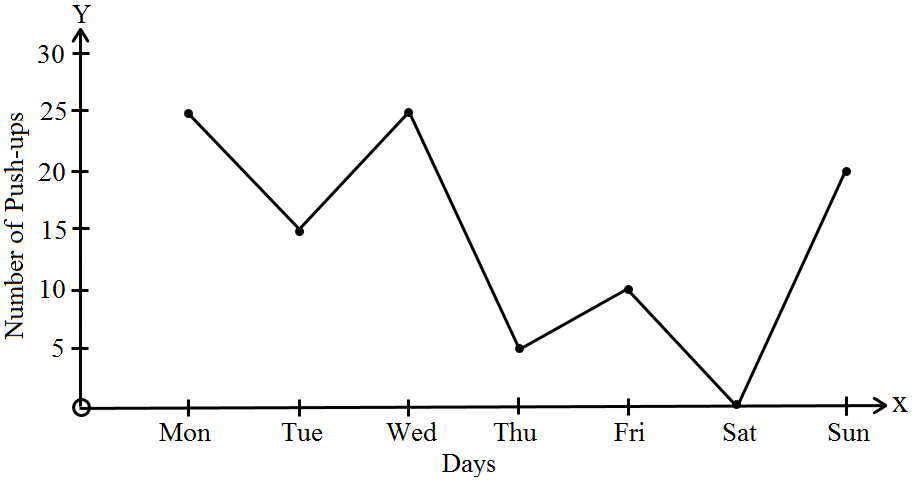
AnswerOn thusday, it's $5$ push-ups. On Wednesday, it's $25$ push-ups. So we need $25 - 5 = 20$ more push-ups.
View full question & answer→MCQ 1351 Mark
A graph that displays data that changes continuously over periods of time is called :
- ✓
- B
Bar$-$graph
- C
Pie$-$chart
- D
View full question & answer→MCQ 1361 Mark
Read the graph and answer the related questions:

The maximum books are of which subject?
MCQ 1371 Mark
Observe the following bar graph and answer the related questions:

On which head/ heads, is the expenditure minimum?
- ✓
Travelling allowance/ rent.
- B
- C
- D
AnswerCorrect option: A. Travelling allowance/ rent.
The length of the bar corresponding to the head travelling allowance/ rent is minimum.
View full question & answer→MCQ 1381 Mark
In which city number of people watching $T.V$ is same as people reading newspaper?

AnswerIn Kolkata people watching $T.V$ is same as reading newspaper i.e $30.$
View full question & answer→MCQ 1391 Mark
Observe the following bar graph and answer the related questions:

What is the difference of expenditures (in thousands of rupees) on salary of employees and rent?
MCQ 1401 Mark
A graph that displays data that changes continuously over periods of time is:
AnswerLine graph is an important way to represent and compare the data which varies continuously.
A line graph displays the relation between two varying quantities.
In a line graph, we connect all the points by a line segment while in bar graph and histogram, we use rectangles of uniform width.
View full question & answer→MCQ 1411 Mark
Find the distance covered in $5$ seconds.

- ✓
$25\ m$
- B
$10\ m$
- C
$20\ m$
- D
AnswerCorrect option: A. $25\ m$
$25\ m$
View full question & answer→MCQ 1421 Mark
Observe the following velocity-time graph and answer the related questions:

What is the fall in velocity from $7$ to $11?$ - A
$80\ km/ hour$
- B
$90\ km/ hour$
- C
$100\ km/ hour$
- ✓
$20\ km/ hour$
AnswerCorrect option: D. $20\ km/ hour$
View full question & answer→MCQ 1431 Mark
Observe the diagram, given below and find the correct answer to the following $MCQs$. 
What is the average score of all the teams? - A
$22\%$
- B
$27\%$
- C
$29\%$
- ✓
$25\%$
AnswerCorrect option: D. $25\%$
Average score = (sum of all scores)/(total number of scores)
View full question & answer→MCQ 1441 Mark
Find the coordinates of the point E from the graph.

- ✓
$(1, -1)$
- B
$(-4, 5)$
- C
$(0, -4)$
- D
AnswerCorrect option: A. $(1, -1)$
$(1, -1)$
View full question & answer→MCQ 1451 Mark
Which of the following points lies on $y-$axis?
- A
$(-4, 0)$
- B
$(4, 0)$
- ✓
$(0, -4)$
- D
$(-4, 4)$
AnswerCorrect option: C. $(0, -4)$
Clearly the point $(0, 4)$ lies on $y-$axis, because it has zero $x$ co-ordinate and $y$ co-ordinate.z
View full question & answer→MCQ 1461 Mark
The following graph shows the temperature forecast $\&$ the actual temperature for each day of a week. On the basis of the graph, answer the following questions.

On which days was the forecast temperature the same as the actual temperature? - A
- ✓
- C
Monday, Tuesday, Wednesday.
- D
Tuesday, Saturday, Sunday.
View full question & answer→MCQ 1471 Mark
The frequency curve is similar to $.........$
AnswerThe frequency curve is similar to line graph.
Because both the graph represents the data in line segment.
View full question & answer→MCQ 1481 Mark
Observe the following temperature time graph and answer the related questions:
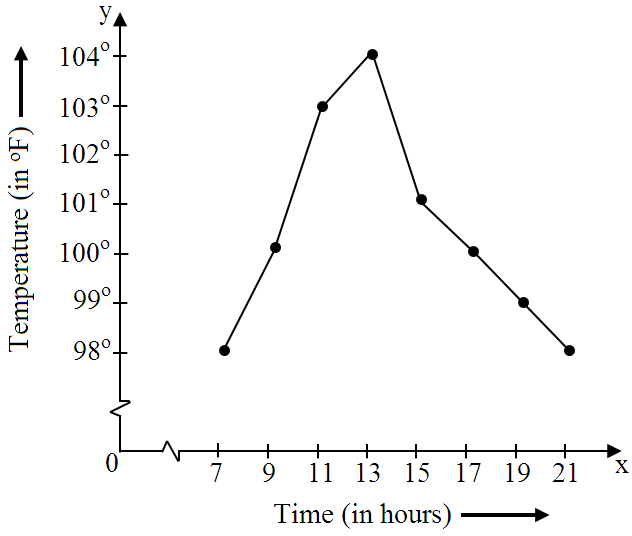
At what time is the temperature maximum?
- ✓
$13$ hours
- B
$15$ hours
- C
$11$ hours
- D
$19$ hours
AnswerCorrect option: A. $13$ hours
$13$ hours $\rightarrow 104^\circ F$
View full question & answer→MCQ 1491 Mark
Read the graph and answer the related questions:

The fall in interest from $2001$ to $2002$ was. View full question & answer→MCQ 1501 Mark
Observe the following circle-graph and answer the related questions:

If the budget of the family is Rs. $10800$, what is the saving? - ✓
Rs. $1050$
- B
Rs. $1000$
- C
Rs. $950$
- D
Rs. $1200$
AnswerCorrect option: A. Rs. $1050$
Saving $=\frac{35}{360}\times10800=1050$
View full question & answer→MCQ 1511 Mark
The point $(-3, -3)$ is:
AnswerCorrect option: D. Equidistant from $x-$axis and $y-$axis.
Equidistant from $x-$axis and $y-$axis.
View full question & answer→MCQ 1521 Mark
Refer the given pie chart and answer the following question: $200$ people are surveyed about the pet they own. Find the number of people who have cats as their pets.
AnswerSince $200$ people are surveyed and we need to find $25\%$ of $200$
So, $25\%$ of $200 =\frac{25}{100}\times200=50$
Therefore, $50$ people have cats as their pets.
View full question & answer→MCQ 1531 Mark
Observe the following circle$-$graph and answer the related questions:

On which head is the expenditure maximum? AnswerThe central angle is maximum for food.
View full question & answer→MCQ 1541 Mark
Observe the following histogram and answer the related questions:
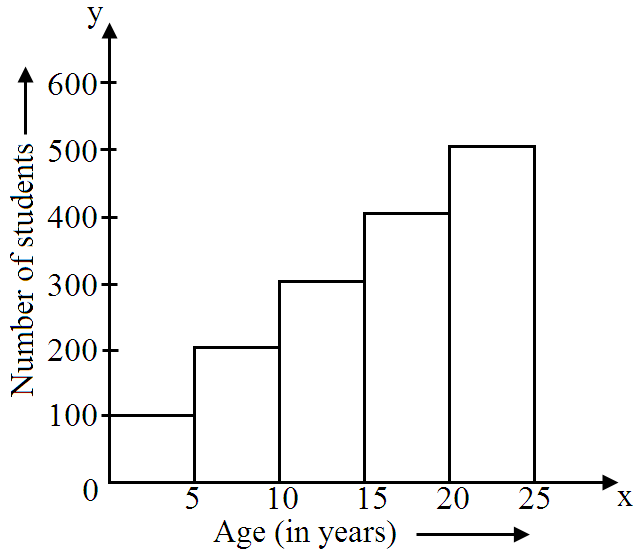
The difference in the number of students of class intervals $0-5$ and $5-10$ is: Answer$0-5 \rightarrow 100$
$5-10 \rightarrow 200$
$200-100 = 100$
View full question & answer→MCQ 1551 Mark
Read the circle graph and answer the related questions:

In which two classes is the number of students the same?
- A
$I$ and $II$
- B
$I$ and $III$
- ✓
$III$ and $IV$
- D
$I$ and $IV$
AnswerCorrect option: C. $III$ and $IV$
$\text{III}\rightarrow12\frac{1}{2}\%$
$\text{IV}\rightarrow12\frac{1}{2}\%$
View full question & answer→MCQ 1561 Mark
Refer the given graph and answer the following question: Which company manufactured the most number of cars for all $5$ years together?

AnswerTotal number of cars manufactured by Company $1(C1)$
$= 460 + 440 + 450 + 440 + 470 = 2260$
Total number of cars manufactured by Company $2(C2) = 450 + 460 + 470 + 450 + 460 = 2290$
So, Company $2$ manufactures most number of cars.
View full question & answer→MCQ 1571 Mark
Read the graph and answer the related questions:

How many books are of subject Home Science?
AnswerHome Science $\rightarrow 100$
View full question & answer→MCQ 1581 Mark
Observe the diagram, given below and find the correct answer to the following $MCQs.$
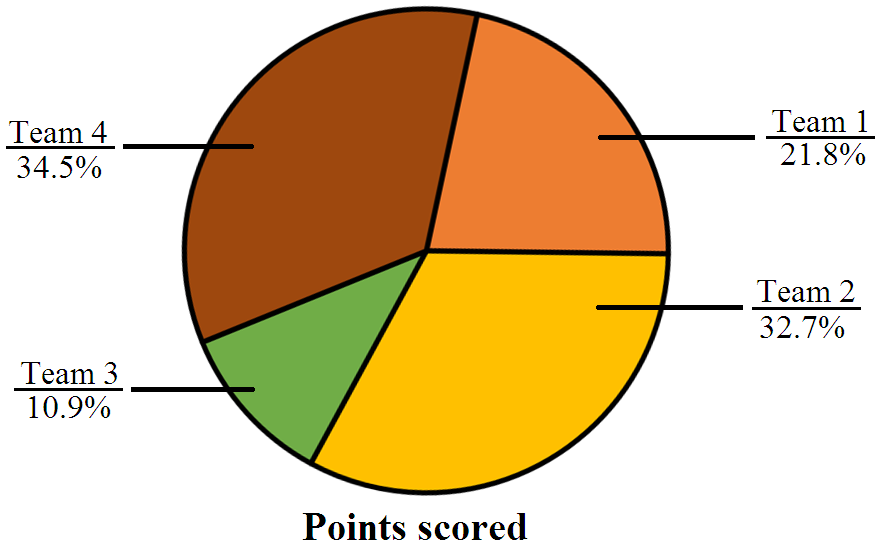
Which team has the second-highest score? - A
Team $1$
- B
Team $4$
- C
Team $3$
- ✓
Team $2$
AnswerCorrect option: D. Team $2$
Team $2$ has the second-highest score, equal to $32.7\%.$
View full question & answer→MCQ 1591 Mark
Refer the given graph and answer the following question: In which year/ years the difference between the numbers of cars manufactured by both the companies was highest?
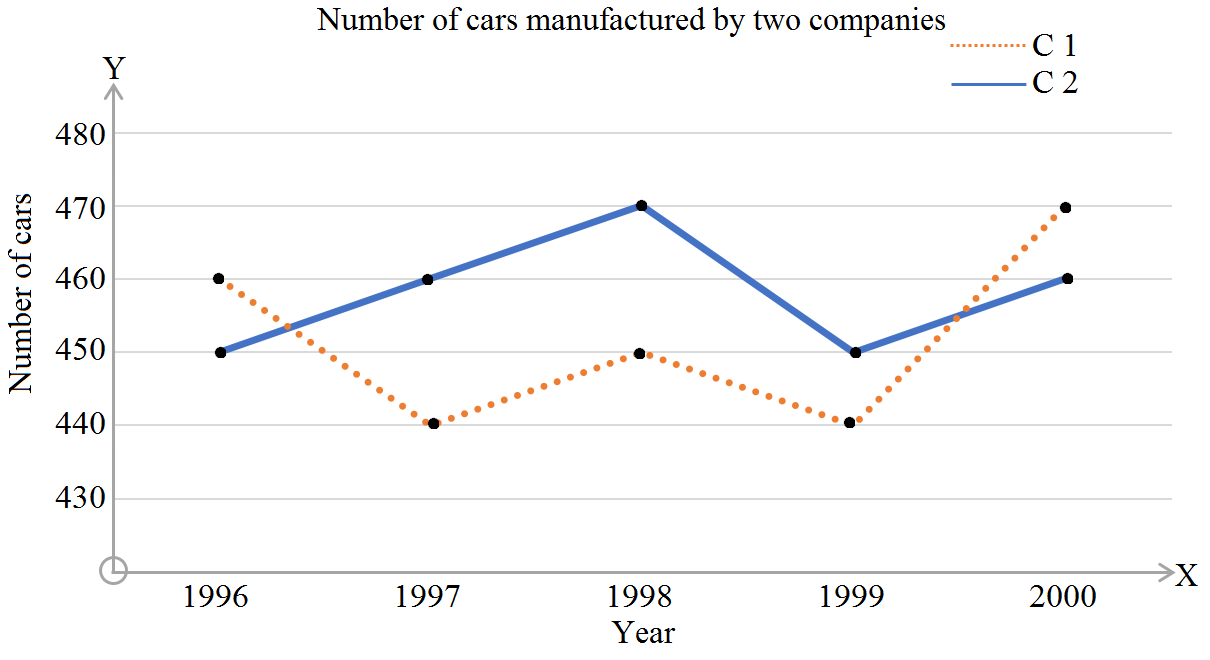
- A
$1997$
- B
Both $1998$ and $1999$
- ✓
Both $1997$ and $1998$
- D
$2000$
AnswerCorrect option: C. Both $1997$ and $1998$
For the year $1996$, difference $= 460 - 450 = 10$
For the year $1997$, difference $= 460 - 440 = 20$
For the year $1998$, difference $= 470 - 450 = 20$
For the year $1999$, difference $= 450 - 440 = 10$
For the year $2000$, difference $= 470 - 460 = 10$
The highest difference in the number of cars is for the years $1997$ and $1998$ both.
View full question & answer→MCQ 1601 Mark
Read the graph and answer the related questions:

In which year was the number of labourers minimum?
- A
$2003$
- B
$2004$
- C
$2005$
- ✓
$2006$
AnswerCorrect option: D. $2006$
$2006 \rightarrow 100$
View full question & answer→MCQ 1611 Mark
The line graph shows the income of $RBI$ department. In which of the years was the annual income the maximum?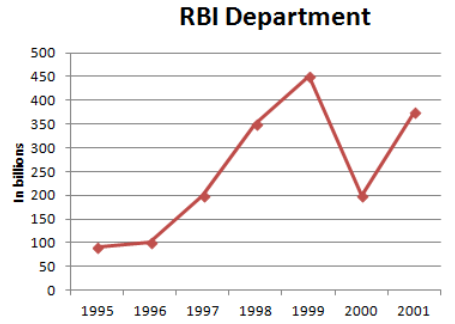
- A
$1996$
- ✓
$1999$
- C
$2000$
- D
$2001$
AnswerCorrect option: B. $1999$
In graph shows the income of the $RBI$ department was maximum in the year $1999.$
View full question & answer→MCQ 1621 Mark
Which of the following represents data that continuously changes over periods of time?
AnswerData that is arranged in columns or rows on a worksheet can be plotted in a line chart. Line charts can display continuous data over time, set against a common scale, and are therefore ideal for showing trends in data at equal intervals. In a line chart, category data is distributed evenly along the horizontal axis, and all value data is distributed evenly along the vertical axis.
View full question & answer→MCQ 1631 Mark
Tick the corect answer in the following: The equation representing the $y-$axis is
- ✓
$x = 0$
- B
$y = 0$
- C
$x = a$
- D
$y = a$
AnswerCorrect option: A. $x = 0$
$x = 0$
View full question & answer→MCQ 1641 Mark
The frequency curve shows temperatures over $11$ year in Bangalore. Use the graph to answer the questions below. Which year had the lowest temperature?
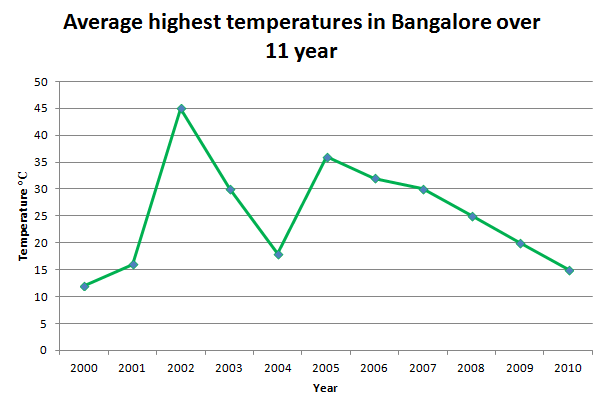
- A
$2001$
- ✓
$2000$
- C
$2002$
- D
$2010$
AnswerCorrect option: B. $2000$
The graph shows that the lowest temperature is in the year $2000.$
View full question & answer→MCQ 1651 Mark
Observe the following runs-over graph and answer the related questions:

In which over are the maximum runs scored?
Answer$VI \rightarrow 11$
View full question & answer→MCQ 1661 Mark
In which graph, rectangle bars are separated?
AnswerIn bar graph, rectangle bars are separated.
View full question & answer→MCQ 1671 Mark
Observe the following histogram and answer the related questions:

In which class interval, are the maximum number of students?
- A
$0-5$
- B
$5-10$
- ✓
$20-25$
- D
$15-20$
AnswerCorrect option: C. $20-25$
The length of the rectangle on $20-25$ is maximum.
View full question & answer→MCQ 1681 Mark
Observe the following circle-graph and answer the related questions:
On which head is the expenditure minimum?
Answer
The central angle is minimum for education.
View full question & answer→MCQ 1691 Mark
The line graph shows the yearly sales figure for a manufacturing company. From the graph, what were the sales in $2005?$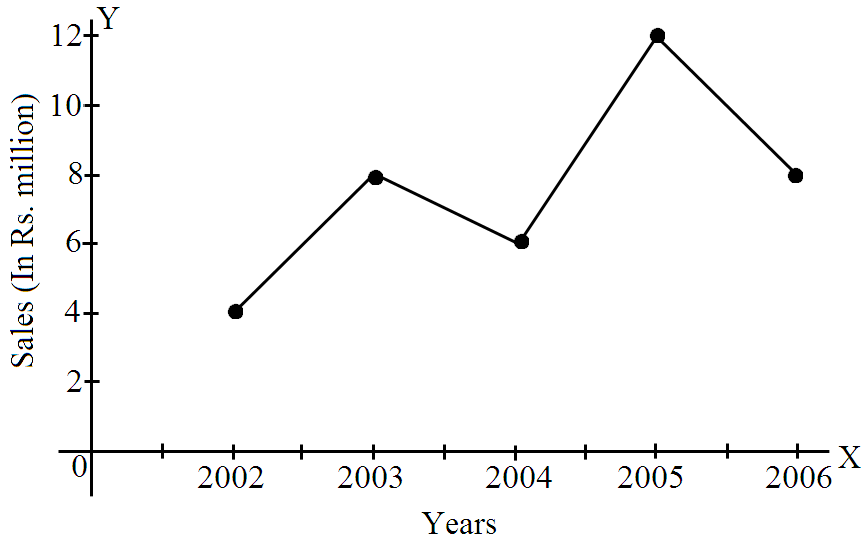
- A
Rs. $4$ millions
- B
Rs. $5$ millions
- C
Rs. $3$ millions
- ✓
Rs. $12$ millions
AnswerCorrect option: D. Rs. $12$ millions
Rs. $12$ millions
View full question & answer→MCQ 1701 Mark
The bar-graph provided gives the sales of books (in thousands) from six branches of a publishing company during two consecutive years $2006$ and $2007.$ Answer the question based on this bar-graph. What is the ratio of the total sales of branch $B_2$ for both years to the total sales of branch $B_4$ for both years?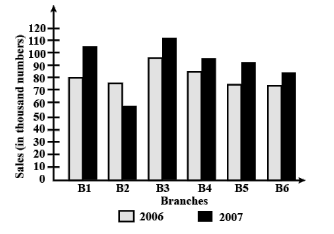
- A
$2:3$
- B
$3:5$
- ✓
$13:18$
- D
$7:9$
AnswerCorrect option: C. $13:18$
C. $13:18$
Solution:
Total sale of branch $B_2$ in two years $= (75 + 55)$ thousands $= 130$ thousands
Total sale of branch $B_4$ in two years $= (85 + 95)$ thousands $= 180$ thousands
Required ratio $=\frac{130}{180}$
$=\frac{30}{80}$
Hence, the required ratio is $13:18.$
View full question & answer→MCQ 1711 Mark
Below is the data of the number of men and women in a village for different years. Now based on this data answer the following $MCQs$ with the correct option.

How many men were there in the village in $2010?$ - A
$500$
- B
$1500$
- ✓
$1000$
- D
$2000$
AnswerCorrect option: C. $1000$
There were $1000$ men in the year $2010$ in the village.
View full question & answer→MCQ 1721 Mark
Refer the green graph and answer the following question: A survey was conducted in a class to see how many girls and boys like a particular ice cream flavour. Find the total number of boys that like the flavour Vanilla, Strawberry and Lemon together?

AnswerNumber of boys who like vanilla flavour $= 15$
Number of boys who like strawberry flavour $= 13$
Number of boys who like Lemon flavour $= 7$
So, total $= 15 + 13 + 7 = 35$
View full question & answer→MCQ 1731 Mark
Read the graph and answer the related questions:

The minimum books are of which subject?
AnswerHome Science $\rightarrow 100$
View full question & answer→MCQ 1741 Mark
Which point lies only on $y-$axis?
- A
$(-2, 0)$
- B
$(2, 0)$
- C
$(2, -2)$
- ✓
$(0, -2)$
AnswerCorrect option: D. $(0, -2)$
$(0, -2)$
View full question & answer→MCQ 1751 Mark
The coordinates of a point at a distance of $3$ units from the $x$ axis and $6$ units from the $y$ axis is:
- A
$(0, 3)$
- B
$(6, 0)$
- C
$(3, 6)$
- ✓
$(6, 3)$
AnswerCorrect option: D. $(6, 3)$
We know that, the $x-$coordinate is the distance of the point from /-axis and the $y-$coordinate is the distance of the point from $X-$axis.
Hence, the coordinates of the required point are $(6, 3).$
View full question & answer→MCQ 1761 Mark
Tick the corect answer in the following: The abscissa of a point is its distance from the-
AnswerCorrect option: C. $Y-$axis.
$Y-$axis.
View full question & answer→MCQ 1771 Mark
Observe the following histogram and answer the related questions:

In which class interval, are the minimum number of students?
- ✓
$0-5$
- B
$5-10$
- C
$10-15$
- D
$15-20$
AnswerThe length of the rectangle on $0-5$ is maximum.
View full question & answer→MCQ 1781 Mark
Tick the corect answer in the following: In which of the following quadrants does the point $(-7, -1)$ lie?
View full question & answer→MCQ 1791 Mark
The bar chart shows the number of workers employed by a trading companyin three years. Calculate the difference between the total number of male and female workers employed over those three years.

AnswerThe number of male workers in $2003=5$, the number of male workers in $2004=7$ and the number of male workers in $2005=9$.
So the total of male workers in $3$yrs.
$=5+7+9=21 .$
Again The number of female workers in $2003=8$, the number of female workers in $2004=9$ and the number of female workers in $2005=5$.
So the total of female workers in $3$yrs.
$=8+9+5=22 .$
$\therefore$ The difference between the male $\&$ female workers $=22-21=1$.
View full question & answer→MCQ 1801 Mark
Read the graph and answer the related questions:
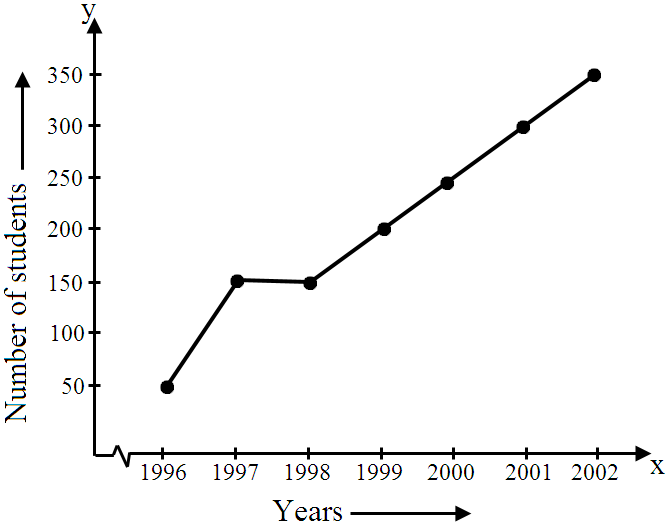
In which two years was the number of students appearing was the same?
- ✓
$1997$ and $1998$
- B
$1998$ and $1999$
- C
$1999$ and $2000$
- D
$2000$ and $2001$
AnswerCorrect option: A. $1997$ and $1998$
$1997 \rightarrow 150$
$1998 \rightarrow 150$
View full question & answer→