Sample QuestionsStatistics and Probability questions
One sample from each question group in this chapter. Select any group above to see the full set with answer keys.
Write the correct answer in the following: In a medical examination of students of a class, the following blood groups are recorded:
|
Blood group
|
$A$
|
$AB$
|
$B$
|
$O$
|
|
Number of Student
|
$10$
|
$13$
|
$12$
|
$5$
|
A student is selected at random from the class. The probability that he/ she has blood group $B$, is: - A
$\frac{1}{4}$
- B
$\frac{13}{40}$
- ✓
$\frac{3}{10}$
- D
$\frac{1}{8}$
Answer: C.
View full solution →Write the correct answer in the following: If $\bar{\text{x}}$ represents the mean of n observations $x_1, x_2, \ldots x_n,$ then value of $\sum\limits_{\text{i}=1}^\text {b} \text{x}_\text{i}-\bar{\text{x}}$ is:
Answer: B.
View full solution →Write the correct answer in the following: A grouped frequency table with class intervals of equal sizes using $250-270$ ($270$ not included in this interval) as one of the class interval is constructed for the following data: $268, 220, 368, 258, 242, 310, 272, 342, 310, 290, 300, 320, 319, 304, 402, 318, 406, 292, 354, 278, 210, 240, 330, 316, 406, 215, 258, 236$. The frequency of the class $310-330$ is:
Answer: C.
View full solution →Write the correct answer in the following: The range of the data: $25, 18, 20, 22, 16, 6, 17, 15, 12, 30, 32, 10, 19, 8, 11, 20$ is:
Answer: D.
View full solution →Write the correct answer in the following: To draw a histogram to represent the following frequency distribution:
|
Class intervai
|
$5-10$
|
$10-15$
|
$15-25$
|
$25-45$
|
$45-75$
|
|
Frequency
|
$6$
|
$12$
|
$10$
|
$8$
|
$15$
|
The adjusted frequency for the class $25-45$ is: Answer: D.
View full solution →A child says that the median of $3, 14, 18, 20, 5$ is $18.$ What doesn’t the child understand about finding the median$?$
View full solution →Can the experimental probability of an event be greater than 1? Justify your anwer.
Can the experimental probability of an event be a negative number? If not, why?
Is it correct to say that in a histogram, the area of each rectangle is proportional to the class size of the corresponding class interval? If not, correct the statement.
As the number of tosses of a coin increases, the ratio of the number of heads to the total number of tosses will be $\frac{1}{2}.$ Is it correct? If not, write the correct one.
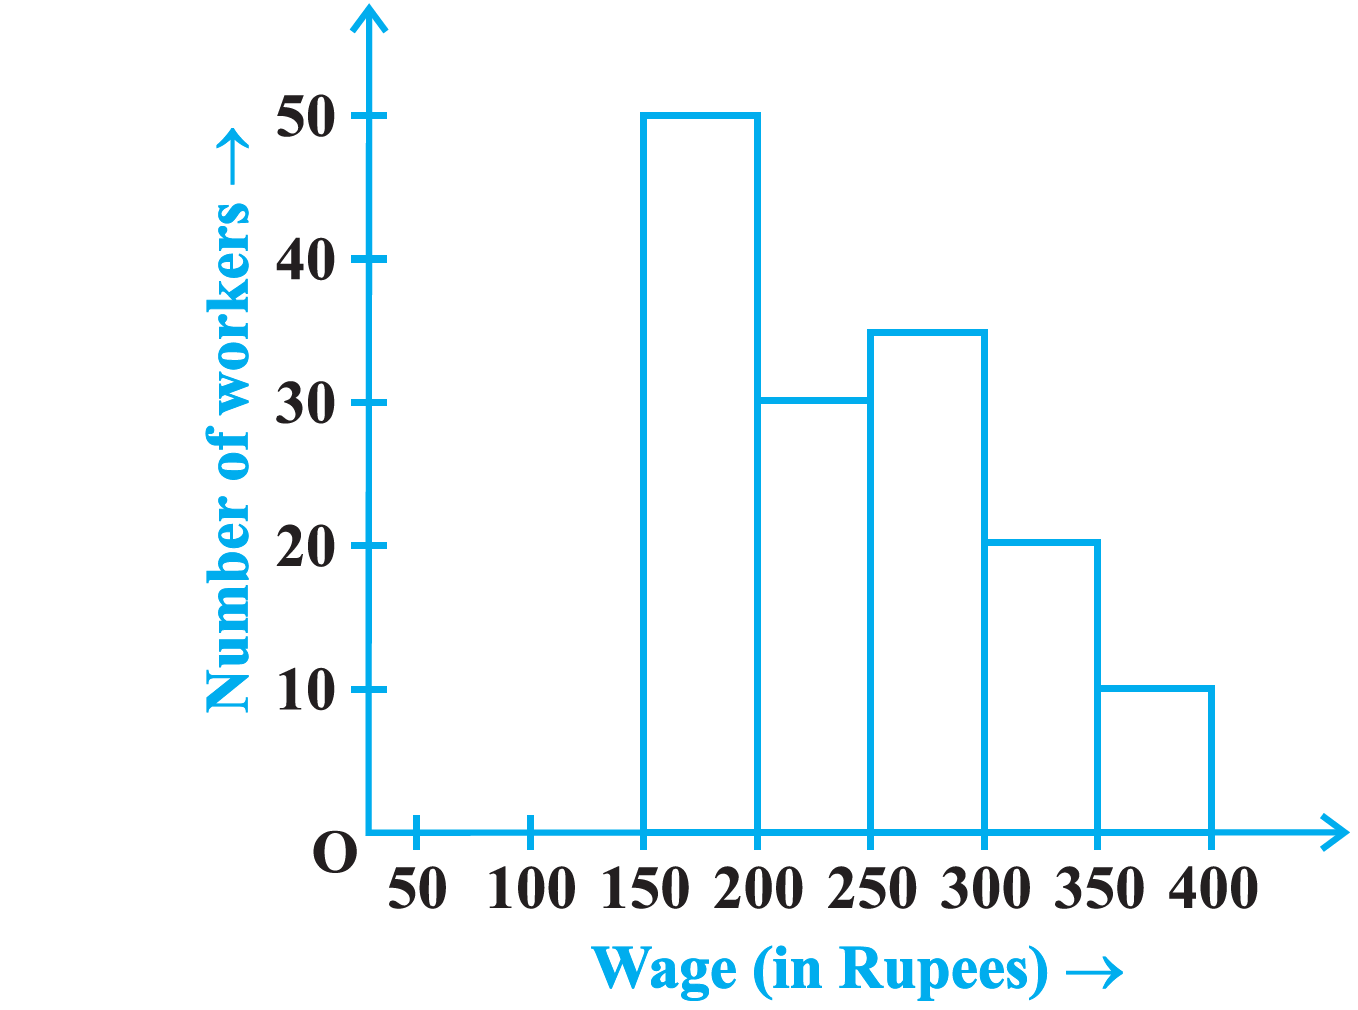
View full solution →In there is a histogram depicting daily wages of workers in a factory. Construct the frequency distribution table.
The points scored by a basket ball team in a series of matches are as follows: $17, 2, 7, 27, 25, 5, 14, 18, 10, 24, 48, 10, 8, 7, 10, 28$. Find the median and mode for the data.
View full solution →$30$ children were asked about the number of hours they watched $TV$ programmes last week. The results are recorded as under:
| Number of hours |
$0-5$ |
$5-10$ |
$10-15$ |
$15-20$ |
| Frequency |
$8$ |
$16$ |
$4$ |
$2$ |
Can we say that the number of children who watched $TV$ for $10$ or more hours a week is $22?$ Justify your answer. View full solution →Mean of $50$ observations was found to be $80.4$. But later on, it was discovered that $96$ was misread as $69$ at one place. Find the correct mean.
View full solution →In a diagnostic test in mathematics given to students, the following marks $($out of $100)$ are recorded: $46, 52, 48, 11, 41, 62, 54, 53, 96, 40, 98, 44$ Which $'$average$’$ will be a good representative of the above data and why?
View full solution →The following table gives the frequencies of most commonly used letters $a, e, i, o, r, t, u$ from a page of a book:
| Letter |
$a$ |
$e$ |
$i$ |
$o$ |
$r$ |
$t$ |
$u$ |
| Frequency |
$75$ |
$125$ |
$80$ |
$70$ |
$80$ |
$95$ |
$75$ |
Represent the information above by a bar graph. View full solution →Obtain the mean of the following distribution:
|
Frequency
|
Varible
|
|
$4$
$8$
$14$
$11$
$3$
|
$4$
$6$
$8$
$10$
$12$
|
View full solution →The blood groups of $30$ students are recorded as follows: $A, B, O, A, AB, O, A, O, B, A, O, B, A, AB, B, A, AB, B, A, A, O, A, AB, B, A, O, B, A, B, A$ Prepare a frequency distribution table for the data.
View full solution →The value of $\pi$ upto $35$ decimal places is given below: $3. 14159265358979323846264338327950288$ Make a frequency distribution of the digits $0$ to $9$ after the decimal point.
View full solution →A company selected $4000$ households at random and surveyed them to find out a relationship between income level and the number of television sets in a home. The information so obtained is listed in the following table:
| Monthly income $($in $Rs.)$ |
Number of Televisions/ household |
| |
$0$ |
$1$ |
$2$ |
Above $2$ |
| $<10000 10000 14999 15000-19999 20000-24999 25000$ and above |
$20 \ 10 \ 0 \ 0 \ 0$ |
$80 \ 240 \ 380 \ 520 \ 1100$ |
$10 \ 60 \ 120 \ 370 \ 760$ |
$0 \ 0 \ 30 \ 80 \ 220$ |
Find the probability:
$i.$ Of a household earning $Rs. 10000 - Rs 14999$ per year and having exactly one television.
$ii.$ Of a household earning $Rs. 25000$ and more per year and owning $2$ televisions.
$iii.$ Of a household not having any television. View full solution →Following table gives the distribution of students of sections $A$ and $B$ of a class according to the marks obtained by them.
|
Section A
|
Section B
|
|
Marks
|
Frequency
|
Marks
|
Frequency
|
|
$0-15$
|
|
$15-30$
|
|
$30-45$
|
|
$45-60$
|
|
$60-75$
|
|
$75-90$
|
|
|
$5$
|
|
$12$
|
|
$28$
|
|
$30$
|
|
$35$
|
|
$13$
|
|
|
$0-15$
|
|
$15-30$
|
|
$30-45$
|
|
$45-60$
|
|
$60-75$
|
|
$75-90$
|
|
|
$3$
|
|
$16$
|
|
$25$
|
|
$27$
|
|
$40$
|
|
$10$
|
|
Represent the marks of the students of both the sections on the same graph by two frequency polygons.What do you observe? View full solution →The expenditure of a family on different heads in a month is given below:
| Head |
Food |
Education |
Clothing |
House Rent |
Others |
Savings |
| Expenditure(in Rs.) |
$4000$ |
$2500$ |
$1000$ |
$3500$ |
$2500$ |
$1500$ |
Draw a bar graph to represent the data above. View full solution →Draw a histogram of the following distribution:
|
Heights (in cm)
|
Number of students
|
|
$150-153$
$153-156$
$156-159$
$159-162$
$162-165$
$165-168$
|
$7$
$8$
$14$
$10$
$6$
$5$
|
View full solution →The mean marks (out of $100$) of boys and girls in an examination are $70$ and $73$, respectively. If the mean marks of all the students in that examination is $71$, find the ratio of the number of boys to the number of girls.
View full solution →Prepare a continuous grouped frequency distribution from the following data:
|
Mid-point
|
Frequency
|
|
$5$
$15$
$25$
$35$
$45$
|
$4$
$8$
$13$
$12$
$6$
|
Also find the size of class intervals. View full solution →
Two dice are thrown simultaneously $500$ times. Each time the sum of two numbers appearing on their tops is noted and recorded as given in the following table:
| Sum |
Frequency |
$2$
$3$
$4$
$5$
$6$
$7$
$8$
$9$
$10$
$11$
$12$ |
$14$
$30$
$42$
$55$
$72$
$75$
$70$
$53$
$46$
$28$
$15$ |
If the dice are thrown once more, what is the probability of getting a sum:
$1. 3?$
$2.$ More than $10?$
$3.$ Less than or equal to $5?$
$4.$ Between $8$ and $12?$