Question 13 Marks
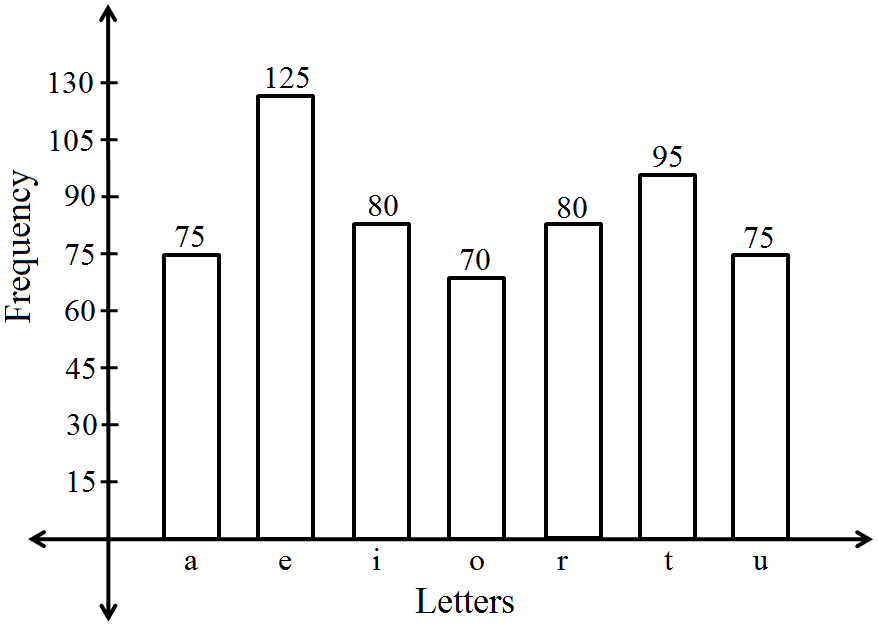
The following table gives the frequencies of most commonly used letters $a, e, i, o, r, t, u$ from a page of a book:
| Letter |
$a$ |
$e$ |
$i$ |
$o$ |
$r$ |
$t$ |
$u$ |
| Frequency |
$75$ |
$125$ |
$80$ |
$70$ |
$80$ |
$95$ |
$75$ |
Represent the information above by a bar graph. AnswerWe draw bar graph of this data in the following steps:
Step I We represent the letters (variable) on the horizontal axis choosing any scale, as the width of the bar is not important. But for clarity, we take equal widths for all bars and maintain equal gaps in between them. Let one letter be represented by one unit.
Step II We represent the letters on the vertical axis. Since, the maximum frequency is $125$ , we can choose the scale as $1$ unit $= 15$ frequency.
Step III To represent our first letter i.e., a, we draw a rectangular bar with width $1$ unit and height 5 units.
Step IV Similarly, other heads are represented by leaving a gap of $1 / 2$ unit in between two consecutive bars. The bar graph for given data is shown below:
View full question & answer→Question 23 Marks
Obtain the mean of the following distribution:
|
Frequency
|
Varible
|
|
$4$
$8$
$14$
$11$
$3$
|
$4$
$6$
$8$
$10$
$12$
|
AnswerWe know that, Mean of the data $(\bar{\text{x}})=\frac{\sum\limits^{5}_{\text{i}=1}\text{f}_\text{i}\text{x}_\text{i}}{\sum\limits^{5}_{\text{i}=1}\text{f}_\text{i}}$
$= \frac{\text{f}_1\text{x}_1+\text{f}_2\text{x}_2+\text{f}_3\text{x}_3+\text{f}_4\text{x}_4+\text{f}_5\text{x}_5}{\text{f}_1+\text{f}_2+\text{f}_3+\text{f}_4+\text{f}_5}$
$=\frac{4\times4+8\times6+14\times8+11\times10+3\times12}{4+8+14+11+3}$
$=\frac{16+48+112+110+36}{40}$
$=\frac{322}{40}=8.05$
Hence, the mean of the given data is $8.05$
View full question & answer→Question 33 Marks
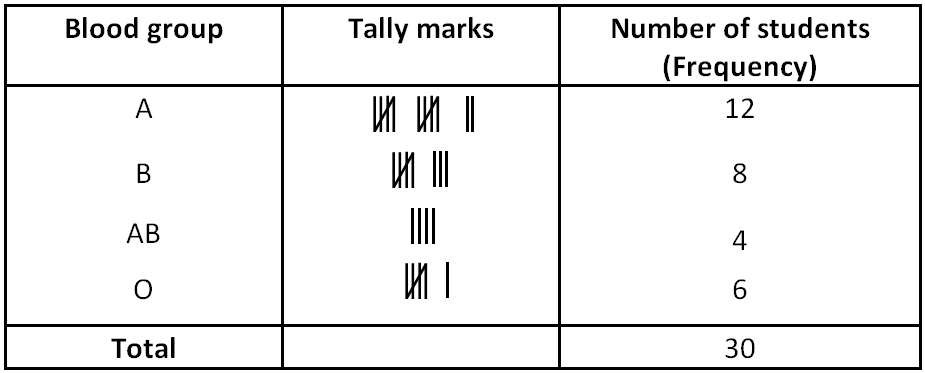
The blood groups of $30$ students are recorded as follows: $A, B, O, A, AB, O, A, O, B, A, O, B, A, AB, B, A, AB, B, A, A, O, A, AB, B, A, O, B, A, B, A$ Prepare a frequency distribution table for the data.
AnswerThe number of students who have a certain type of blood group is called the frequency of those blood groups. A frequency distribution table for the given data is given below:
View full question & answer→Question 43 Marks
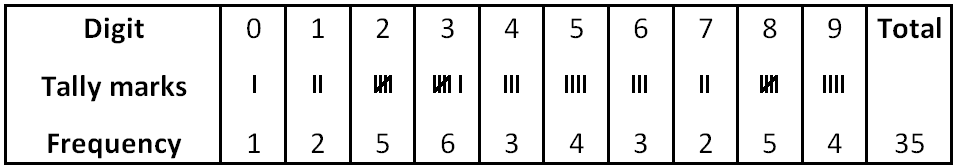
The value of $\pi$ upto $35$ decimal places is given below: $3. 14159265358979323846264338327950288$ Make a frequency distribution of the digits $0$ to $9$ after the decimal point.
AnswerThe number of repeated digit is called the frequency of those digits. A frequency distribution table for the given data is given below:
View full question & answer→Question 53 Marks
A company selected $4000$ households at random and surveyed them to find out a relationship between income level and the number of television sets in a home. The information so obtained is listed in the following table:
| Monthly income $($in $Rs.)$ |
Number of Televisions/ household |
| |
$0$ |
$1$ |
$2$ |
Above $2$ |
| $<10000 10000 14999 15000-19999 20000-24999 25000$ and above |
$20 \ 10 \ 0 \ 0 \ 0$ |
$80 \ 240 \ 380 \ 520 \ 1100$ |
$10 \ 60 \ 120 \ 370 \ 760$ |
$0 \ 0 \ 30 \ 80 \ 220$ |
Find the probability:
$i.$ Of a household earning $Rs. 10000 - Rs 14999$ per year and having exactly one television.
$ii.$ Of a household earning $Rs. 25000$ and more per year and owning $2$ televisions.
$iii.$ Of a household not having any television. Answer$i.$ So, required probability $=\frac{240}{4000}=\frac{60}{1000}=0.06$
$ii.$ Number of households earning $Rs. 25000$ and more per year and owing $2$ televisions $= 460$
So, required probability $=\frac{760}{4000}=0.19$
$iii.$ Number of households not having any televisions $= 20 + 10 = 30$
So, required probability $=\frac{30}{4000}=\frac{3}{400}$
View full question & answer→Question 63 Marks
The scores (out of 100) obtained by $33$ students in a mathematics test are as follows: $69, 48, 84, 58, 48, 73, 83, 48, 66, 58,$ $84000 66, 64, 71, 64, 66, 69, 66, 83, 66, 69, 71 81, 71, 73, 69, 66, 66, 64, 58, 64, 69, 69$ Represent this data in the form of a frequency distribution.
AnswerFrequency distribution table.
|
Scores
|
Frequency
|
|
$48$
$58$
$64$
$66$
$69$
$71$
$73$
$81$
$83$
$84$
|
$3$
$3$
$4$
$7$
$6$
$3$
$2$
$1$
$2$
$2$
|
View full question & answer→Question 73 Marks
A class consists of $50$ students out of which $30$ are girls. The mean of marks scored by girls in a test is $73$ (out of $100$) and that of boys is $71$. Determine the mean score of the whole class.
AnswerThere are $50 $students in a class. Out of these $50$ students, $30$ are girls.
So, number of boys in the class $= 50 - 30 = 20$
Mean markes of $30 $girls $= 73$
Total markes of girls $= 73$
Mean marks of $20$ boys $= 71$
Total marks of $20$ boys $= 71 \times 20 = 1420$
Hence, mean of the whole class $=\frac{2190+1420}{50}=\frac{3610}{50}=72.2$
View full question & answer→Question 83 Marks
Ten observations $6, 14, 15, 17, x + 1, 2x - 13, 30, 32, 34, 43$ are written in an ascending order. The median of the data is$ 24.$ Find the value of$ x.$
AnswerTen observations $6, 14, 15, 17, x + 1, 2x - 13, 30, 32, 34, 43,$ are in an ascending order.
Here, n = 10(even) $\therefore\text{ Median}=\text{average of}\Big(\frac{10}{2}\Big)^{\text{th}}\text{value and}\Big(\frac{10}{2}+1\Big)^{\text{th}}\text{value}$
$=\text{average of 5}^{\text{th }}\text{item and }6^{\text{th}}\text{ item}$
$\text{Median}=\frac{\text{x}+1+2\text{x}-13}{2}=\frac{3\text{x}-12}{2}$
Now, $\frac{3\text{x}-12}{2}=24$
$3\text{x}=48+12=60$
$\therefore\ \text{x}=60\div3=20$
Hence, the value of $x = 20$
View full question & answer→Question 93 Marks
A football player scored the following number of goals in the $10$ matches: $1, 3, 2, 5, 8, 6, 1, 4, 7, 9$ Since the number of matches is $10$ (an even number), therefore, the median. $=\frac{5^{\text{th}}\text{observation}+6^{\text{th}}\text{observation}}{2}$ $=\frac{8+6}{2}=7$ Is it the correct answer and why?
AnswerNo. It is not the correct answer, because the data have to be arranged in ascending or descending order before finding the median. Arranging the data in ascending order $1,1,2, 3, 4, 5, 6, 7, 8, 9. .$
Here, number of observations is $10$, which is even.
So, $\text{median}=\frac{\big(\frac{\text{n}}{2}\big)^{\text{th}}\text{observation}+\big(\frac{\text{n}}{2}+1\big)^{\text{th}}\text{observation}}{2}$
$=\frac{\big(\frac{\text{10}}{2}\big)^{\text{th}}\text{observation}+\big(\frac{\text{10}}{2}+1\big)^{\text{th}}\text{observation}}{2}$
$=\frac{5^{\text{th}}\text{observation}+6^{\text{th}}\text{observation}}{2}$
$=\frac{4+5}{2}=\frac{9}{2}=4.5$
View full question & answer→Question 103 Marks
Bulbs are packed in cartons each containing $40$ bulbs. Seven hundred cartons were examined for defective bulbs and the results are given in the following table:
| Number of defective bulbs |
$0$ |
$1$ |
$24$ |
$3$ |
$4$ |
$5$ |
$6$ |
more than $6$ |
| Frequency |
$400$ |
$180$ |
$48$ |
$41$ |
$18$ |
$8$ |
$3$ |
$2$ |
One carton was selected at random. What is the probability that it has:
$i.$ No defective bulb?
$ii.$ Defective bulbs from $2$ to $6?$
$iii.$ Defective bulbs less than $4?$ AnswerTotal number of cartons, $n (S)=700$
$i.$ Number of cartons which has no defective bulb, $n\left(E_1\right)=400$
$\therefore$ Probability that no defective bulb $=\frac{ n \left(E _1\right)}{ n (S)}=\frac{400}{700}=\frac{4}{7}$
Hence, the probability that no defective bulb is $\frac{4}{7}$
$ii.$ Number of catons which has defective bulbs from $2$ to $6, n\left(E_2\right)=48+41+18+8+3=118$
probability that no defective bulbs from $2$ to $6=\frac{ n \left(E _2\right)}{ n (S)}=\frac{118}{700}=\frac{59}{350}$
Hence, the probability that the defective bulbs from $2$ to $6$ is $\frac{59}{350}$
$iii.$ Number of cartons which has defective bulbs less that $4$
$n\left(E_3\right)=400+180+48+41=669$
$\therefore$ The probability that the defective bulbs less than $4=\frac{ n \left(E _3\right)}{ n (S)}=\frac{669}{700}$
Hence, the probability that the defective bulb less than $4$ is $\frac{669}{700}$
View full question & answer→Question 113 Marks
The frequency distribution:
|
Marks
|
$0-20$
|
$20-40$
|
$40-60$
|
$60-100$
|
|
Number of student
|
$10$
|
$15$
|
$20$
|
$25$
|
has been represented graphically as follows: 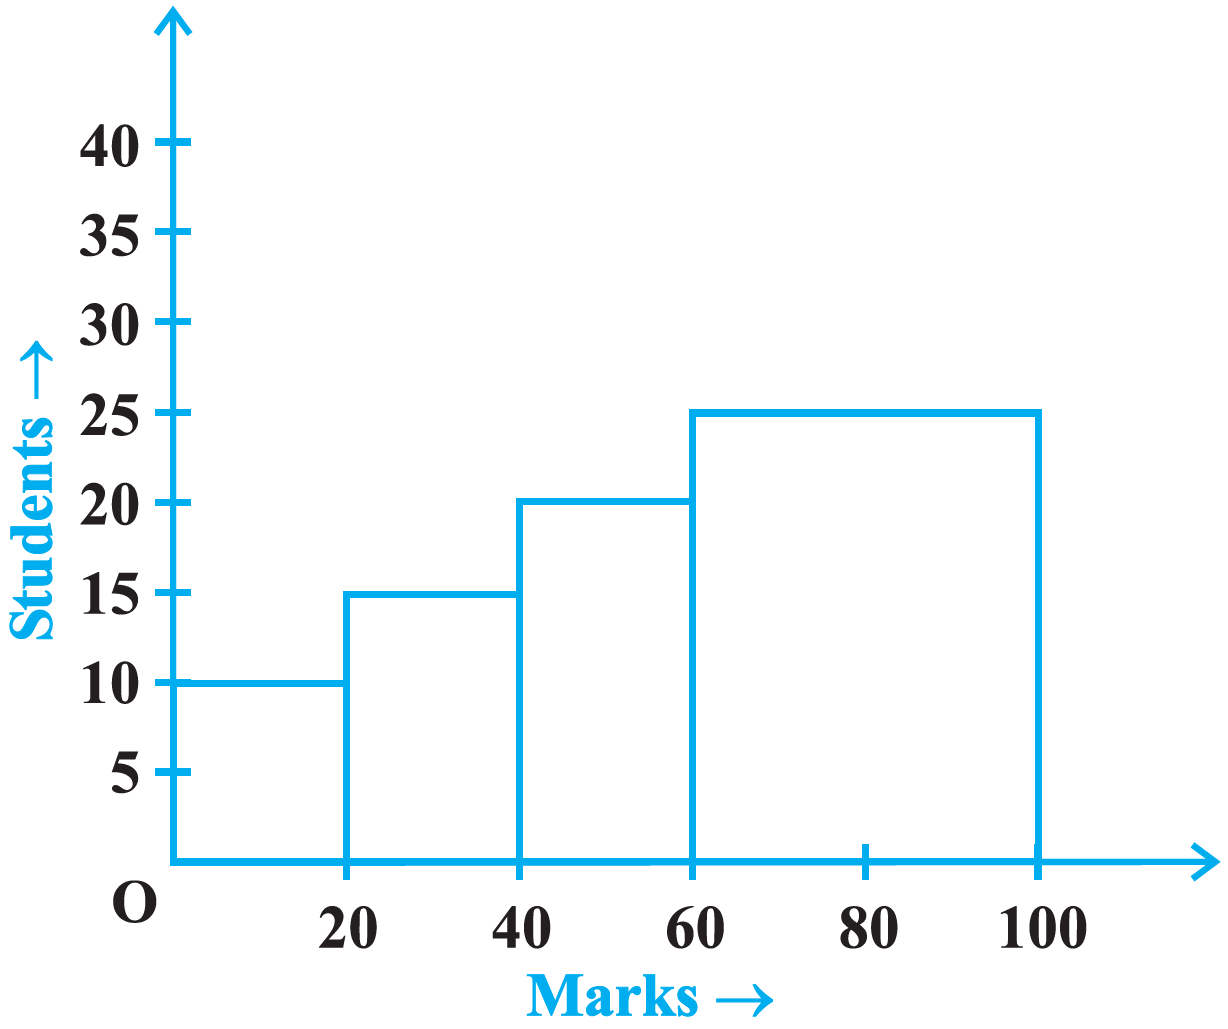 Do you think this representation is correct? Why?
 AnswerThis representation is not correct. The classes $0 - 20, 20 - 40, 40 - 60$ and $60 - 100$ are not of uniform width but of varying widths. Width $60 - 80$ is given.
View full question & answer→Question 123 Marks
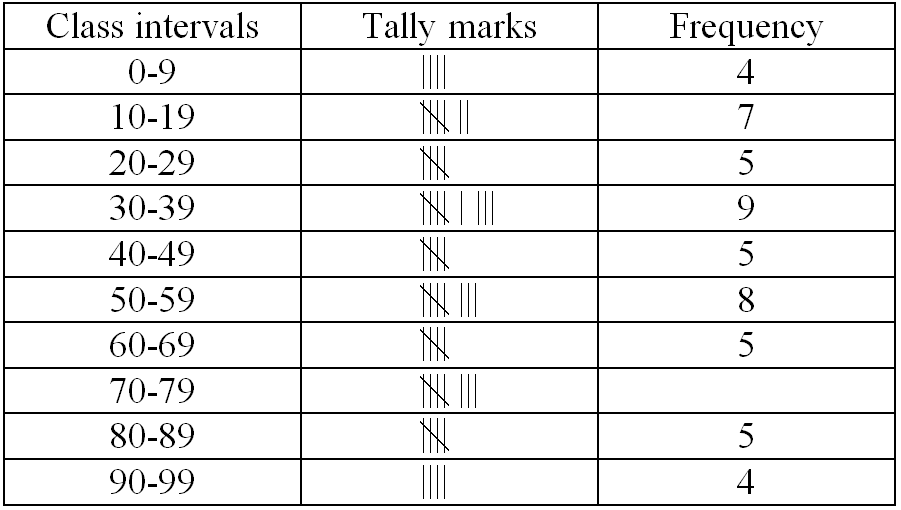
The following are the marks (out of 100) of 60 students in mathematics: $16, 13, 5, 80, 86, 7, 51, 48, 24, 56, 70, 19, 61, 17, 16, 36, 34, 42, 34, 35, 72, 55, 75, 31, 52, 28,72, 97, 74, 45, 62, 68, 86, 35, 85, 36, 81, 75, 55, 26, 95, 31, 7, 78, 92, 62, 52, 56, 15, 63,25, 36, 54, 44, 47, 27, 72, 17, 4, 30$ Construct a grouped frequency distribution table with width $10$ of each class starting from $0-9.$
AnswerWe have $0-9$ as one of the class intervals and the class size is the same, Therefore, the classes of equal size and $0-9, 10-19, ....., 90-99.$ Frequency Distribution Table.
View full question & answer→Question 133 Marks
If the mean of the following data is $20.2$, find the value of $p:$
|
$x$
|
$10$
|
$15$
|
$20$
|
$25$
|
$30$
|
|
$f$
|
$6$
|
$8$
|
$p$
|
$10$
|
$6$
|
AnswerWe know that, Mean of the data $(\bar{\text{x}})=\frac{\sum\limits^{5}_{\text{i}=1}\text{f}_\text{i}\text{x}_\text{i}}{\sum\limits^{5}_{\text{i}=1}}=20.2$ [given]
$\Rightarrow\ \frac{\text{f}_1\text{x}_1+\text{f}_2\text{x}_2+\text{f}_3\text{x}_3+\text{f}_4\text{x}_4+\text{f}_5\text{x}_5}{\text{f}_1+\text{f}_2+\text{f}_3+\text{f}_4+\text{f}_5}$
$\Rightarrow\ \frac{(6)(10)+(8)(15)+(\text{p})(20)+(10)(25)+(6)(30)}{6+8+\text{p}+10+6}=20.2$
$\Rightarrow\ \frac{60+120+20\text{p}+250+180}{30+\text{p}}=20.2$
$\Rightarrow\ 20\text{p}+610=606+20.2\text{p}$
$\Rightarrow\ 610-606=0.2\text{p}$
$\Rightarrow\ \frac{2\text{p}}{10}=4$
$\therefore\ \text{p}=10\times2=20$
Hence, the value of $p$ is $20$
View full question & answer→Question 143 Marks
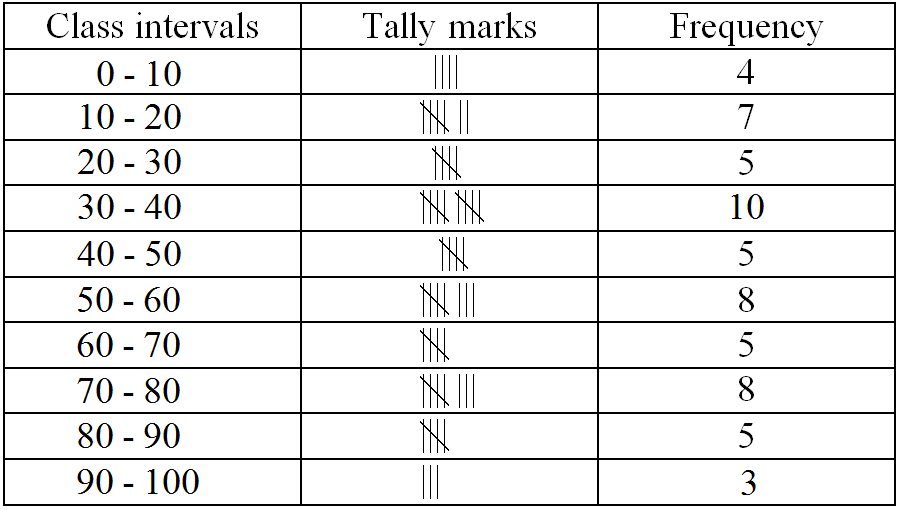
Construct a grouped frequency distribution table with width $10$ of each class, in such a way that one of the classes is $10-20 (20$ not included).
AnswerWe arrange the given data into groups like $0-10, 10-20, 20-30$ in which upper class limit is not included in that class. The class width in each case is $10$. The frequency distribution of the given data is given below:
View full question & answer→