Question types

Geography ch 6 - Population question types

23 questions across 10 question groups — pick any mix to generate a Social Studies paper with step-by-step answer keys.

23
Questions
10
Question groups
5
Question types
Sample Questions

Geography ch 6 - Population questions

One sample from each question group in this chapter. Select any group above to see the full set with answer keys.
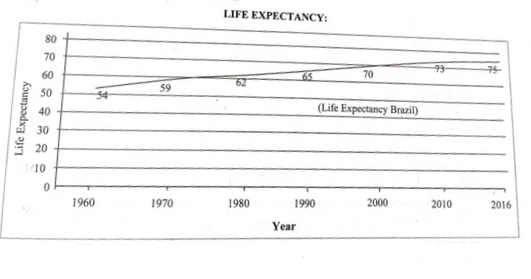
Q 1MCQ1 Mark
On the distribution of population ___________ factor affects.
  • A
    physiographic
  • B
    sex ratio
  • C
    literacy
  • D
    life expectancy
View full solution
Q 2MCQ1 Mark
Brazil is the _____________ populated country in the South American continent.
  • A
    Less
  • B
    Medium
  • C
    Very less
  • D
    Very high
View full solution
Q 3MCQ1 Mark
With reference to area Brazil stands ______________ in the world.
  • A
    Fifth
  • B
    Seventh
  • C
    First
  • D
    Ninth
View full solution
Q 4MCQ1 Mark
Population wise India is ___________ largest country in the world.
  • A
    First
  • B
    Fifth
  • C
    Seventh
  • D
    Second
View full solution
Q 8MCQ1 Mark
On the distribution of population ___________ factor affects.
  • A
    physiographic
  • B
    sex ratio
  • C
    literacy
  • D
    life expectancy
View full solution
Q 9MCQ1 Mark
Brazil is the _____________ populated country in the South American continent.
  • A
    Less
  • B
    Medium
  • C
    Very less
  • D
    Very high
View full solution
Q 10MCQ1 Mark
With reference to area Brazil stands ______________ in the world.
  • A
    Fifth
  • B
    Seventh
  • C
    First
  • D
    Ninth
View full solution
Q 11MCQ1 Mark
Population wise India is ___________ largest country in the world.
  • A
    First
  • B
    Fifth
  • C
    Seventh
  • D
    Second
View full solution
View full solution
Q 15Graph4 Marks
With the help of given statistical data, prepare a simple bar graph and answer the following questions:
Life Expectancy - India
YearsLife Expectancy
198054
199058
200063
201067
201668
Questions:
1. In the year 1990 what is the average life expectancy?
2. In which two decades, the average life expectancy is found to be similar increase?
3. How much increase can be seen in the life expectancy from 1990 to 2016?
View full solution
Q 17Graph4 Marks
Observe the following graphs and answer the questions given below them.
Image
1. What do the above graphs show?
2. Which country has highest male population?
3. Which country has highest female population?
4. Which country has rapid increase in female population after 2001?
View full solution
Q 18Graph4 Marks
Read the graph and answer the following questions:
Image
1. What does the above graph show?
2. In which age group population is more?
3. What is the class interval of the data shown on ' Y ' axis?
4. In the age group of above 60 years whose population is more, male or female?
View full solution

Generate a Geography ch 6 - Population paper free

Pick question groups from the list above, set marks and difficulty, and export a branded PDF with step-by-step answer keys. First 3 chapters free — no signup.

Download App