Question
✓
Answer
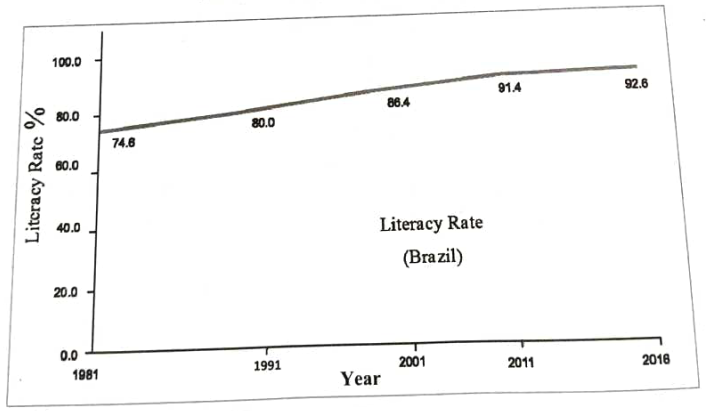
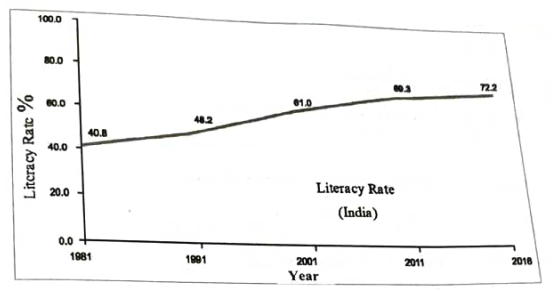
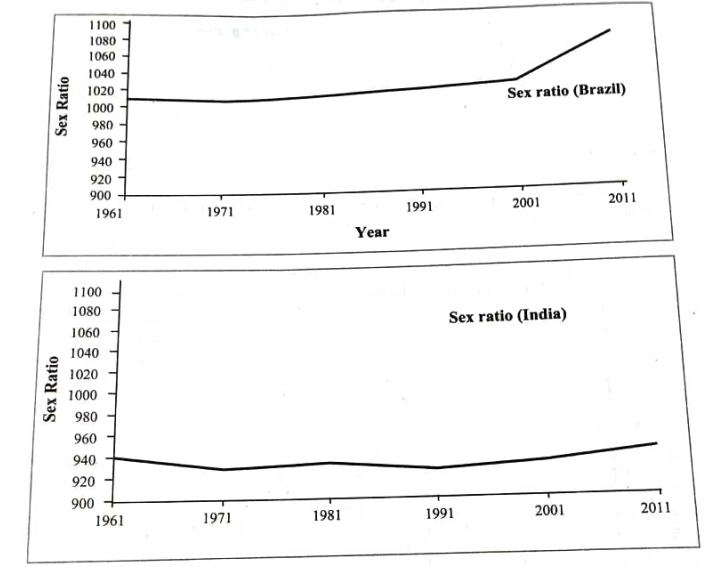
1. The above graphs indicates the literacy rate of Brazil and India.
2. Brazil has a high literacy rate.
3. In the year 2001 the literacy rate in Brazil is more than India by 25.4 %.
4. The highest literacy rate in India is 72.2 %.
2. Brazil has a high literacy rate.
3. In the year 2001 the literacy rate in Brazil is more than India by 25.4 %.
4. The highest literacy rate in India is 72.2 %.
Need a full question paper?
Generate a complete, print-ready paper with questions like this in minutes — across 16+ boards, with answer keys.
Explore more
Similar questions
Prepare a simple bar graph with the help of given statistical information and answer the questions given below-
Brazil-% of urban population
| Year | % of urban population |
| 1960 | 47.1 |
| 1970 | 56.8 |
| 1980 | 66.0 |
| 1990 | 74.6 |
| 2000 | 81.5 |
| 2010 | 84.6 |
Questions-
- What is the interval of years in the data?
- During which year did rapid urbanization start?
- Write five sentences about the analysis of graph.
Observe the following graph and answer the questions given below-
Brazil- % of population (2016)
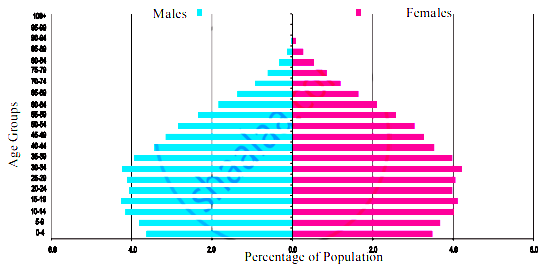
- Which type of graph is this?
- Which age group has the highest population?
- Write class interval of age groups given on Y-axis.
- Whose number is more in males and females of age above 60?
- How much percent of females are found in age group of 55 to 59 years?
- After which age group is the decrease in population found?
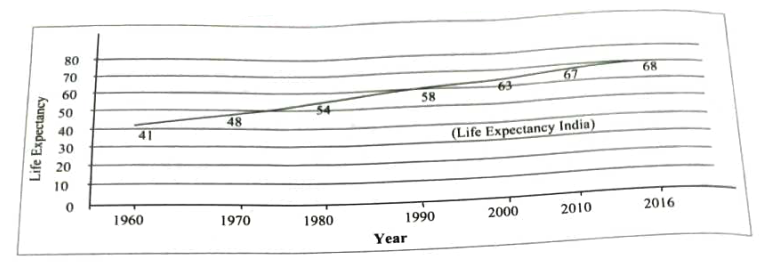
With the help of given statistical data, prepare a simple bar graph and answer the following questions:
Life Expectancy - India
Questions:
1. In the year 1990 what is the average life expectancy?
2. In which two decades, the average life expectancy is found to be similar increase?
3. How much increase can be seen in the life expectancy from 1990 to 2016?
Life Expectancy - India
| Years | Life Expectancy |
| 1980 | 54 |
| 1990 | 58 |
| 2000 | 63 |
| 2010 | 67 |
| 2016 | 68 |
1. In the year 1990 what is the average life expectancy?
2. In which two decades, the average life expectancy is found to be similar increase?
3. How much increase can be seen in the life expectancy from 1990 to 2016?
Observe the following graph and answer the questions given below-
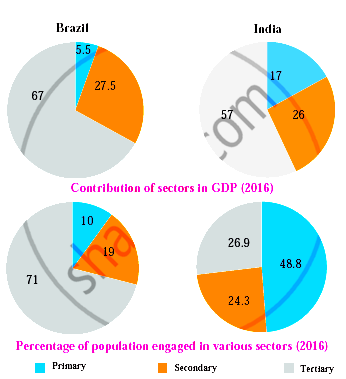
- Which country has a higher percent of the population engaged in primary activities?
- In which country is the contribution of tertiary sector greater in the GDP?
- In which country is the share of secondary activities more in the GDP?
- Can we say that Brazil is an agrarian economy like India? Give reasons.
- Which country has a higher percent of the population engaged in secondary activities?
- How muchpercent of population is engaged in tertiary activities in India?
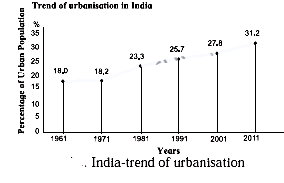
Read the graph in fig below and answer the following questions:
- What was the percentage of urbanisation in 1961?
- In which decade was urbanisation the highest?
- In which decade was the growth of urbanisation lowest?
- What inference can you draw regarding India’s urbanisation after reading the graph?
- In which decade is the percentage of urbanization 27.8?
- What is the difference between the percentage of urbanisation from 1971 and 1981?
→
With the help of given statistical data, prepare a simple bar graph and answer the following questions:
India-Trade % of GDP
(1980 to 2016)
Questions:
(1) What does the graph show?
(2) What was the contribution of trade in GDP in the year 2010?
(3) How much was a decrease in the percentage of GDP in the year from 2010 to 2016?
India-Trade % of GDP
(1980 to 2016)
| Years | Percentage of GDP |
| 1980 | 15 |
| 1990 | 16 |
| 2000 | 58 |
| 2010 | 50 |
| 2016 | 40 |
(1) What does the graph show?
(2) What was the contribution of trade in GDP in the year 2010?
(3) How much was a decrease in the percentage of GDP in the year from 2010 to 2016?
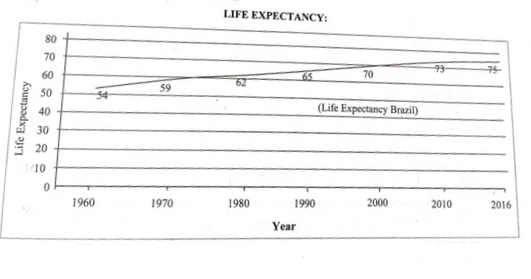
Prepare a simple bar graph with the help of given statistical information and answer the questions given below-
Brazil-life expectancy
| Years | Life expectancy |
| 1960 | 54 |
| 1970 | 59 |
| 1980 | 61 |
| 1990 | 65 |
| 2000 | 70 |
| 2010 | 73 |
| 2016 | 75 |
Questions-
- What is the interval of years in the data?
- What is the difference in life expectancy of 1960 and 2016?
- Write five sentences about the analysis of graph.