_________ is a port on the confluence of the Negro and the Amazon rivers, where urbanisation has occurred.
- AAlagoas
- BParana
- ✓Manaus
- DCeara
Answer: C.
View full solution →33 questions across 6 question groups — pick any mix to generate a Social Studies paper with step-by-step answer keys.
MCQ
18 Q→02Answer the following in one sentence
3 Q→03Answer the following questions in details.
1 Q→04Give geographical reasons for the following
1 Q→05Are the sentences right or wrong. Rewrite the wrong ones
5 Q→06Observe the following diagram and answer the following questions
5 Q→One sample from each question group in this chapter. Select any group above to see the full set with answer keys.
Answer: C.
View full solution →Answer: B.
View full solution →Answer: D.
View full solution →Answer: C.
View full solution →Answer: C.
View full solution →
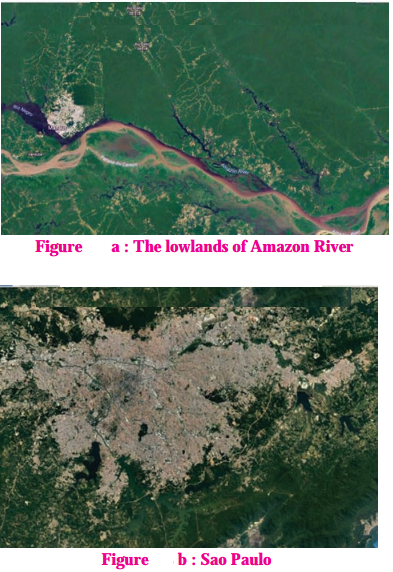
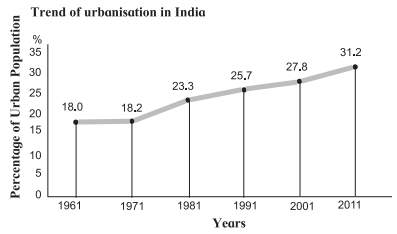
(1) What was the percentage of urbanisation in 1961?
(2) In which decade was urbanisation the highest?
(3) In which decade was the growth of urbanisation lowest?
(4) What was the growth in the percentage of urbanisation between 1961 and 1971?
(5) What was the growth in the percentage of urbanisation between 1991 and 2011?
(6) What inference can you draw regarding India’s urbanisation after reading the graph?
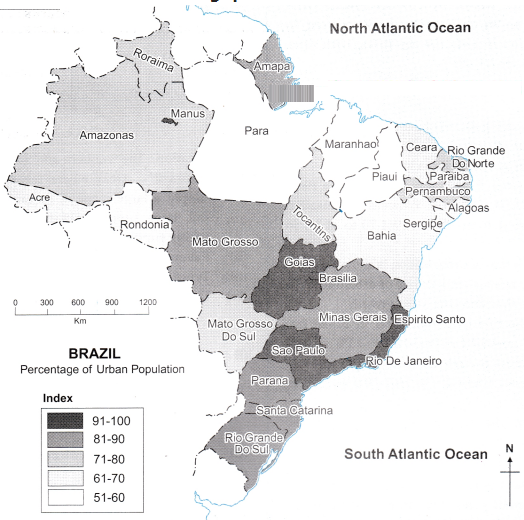
(1) Which state (region) in Brazil is the most urbanised?
(2) Which state (region) in the least urbanised?
| S.No. | Urban population percentage category | States /UTs falling in the category |
| (1) | 0-20 | Himachal Pradesh, Bihar, Assam and Odisha |
| (2) | 21-40 | Meghalaya, Uttar Pradesh, Arunachal Pradesh, Chhattisgarh, Jharkhand, Rajasthan, Sikkim, Tripura, Jammu and Kashmir, Nagaland, Manipur, Uttarakhand, West Bengal, Andhra Pradesh, Haryana, A and N Islands, Punjab, Karnataka and M. P. |
| (3) | 41-60 | Gujarat, Maharashtra, Dadra and Nagar Haveli, Kerala, Tamil Nadu, Mizoram |
| (4) | 61-80 | Goa, Puducherry, Daman and Diu, Lakshadweep |
| (5) | 81 -100 | Chandigarh, NCT of Delhi |
Pick question groups from the list above, set marks and difficulty, and export a branded PDF with step-by-step answer keys. First 3 chapters free — no signup.