Question types

Bar Graphs question types

10 questions across 3 question groups — pick any mix to generate a Maths paper with step-by-step answer keys.

10
Questions
3
Question groups
5
Question types
Sample Questions

Bar Graphs questions

One sample from each question group in this chapter. Select any group above to see the full set with answer keys.

Q 13 Mark Question3 Marks
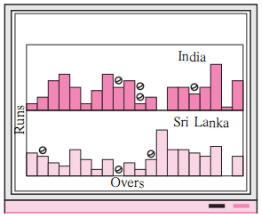
Observe the picture alongside: (Textbook pg. no. 35)

  1. To which sport is this data related?
  2. How many things does the picture tell us about?
  3. What shape has been used in the picture to represent runs?

Image

View full solution
Q 24 Mark Question4 Marks
Write the names of four of your classmates. Beside each name, write his/her weight in kilograms. Enter this data in a table like the above and make a bar graph.
Name of classmatesWeight (kg)
Rohan32
Laxmi28
Rakesh40
Riya36
View full solution
Q 34 Mark Question4 Marks
A pictogram of the types and numbers of vehicles in a city is given below.
Taking 1 picture = 5 vehicles, write the numbers in the pictogram.

Image

View full solution
Q 45 Mark Question5 Marks
Yashwant gives different amounts of time as shown below, to different exercises he does during the week. Draw a bar graph to show the details of his schedule using an appropriate scale.
Type of exercise Running Yogasanas Cycling Mountaineering Badminton
Time 35 minutes 50 minutes 1 hr 10 min 1(1)/(2) hours 45 minutes
View full solution
Q 55 Mark Question5 Marks
Students planted trees in 5 villages of Sangli district. Make a bar graph of this data. (Scale: On Y-axis, 1 cm = 100 trees).
Name of PlaceDudhgaonBagniSamdoliAshtaKavathepiran
Number of Trees Planted500350600420540
View full solution
Q 65 Mark Question5 Marks
The number of customers who came to a juice centre during one week is given in the table below. Make two different bar graphs to show this data.
(On Y-axis, 1 cm = 10 customers, 1 cm = 5 customers)
Type of juiceOrangePineappleAppleMangoPomegranate
Number of customers5030256510
View full solution
Q 75 Mark Question5 Marks
The table below gives the number of children who took part in the various items of the talent show as part of the annual school gathering. Make a bar graph to show this data.
(Scale: On Y-axis, 1 cm = 4 children)
ProgrammeTheaterDanceVocal musicInstrumental musicOne-act plays
Number of Children24401684
View full solution
Q 85 Mark Question5 Marks
The names and numbers of animals in a certain zoo are given below. Use the data to make a bar graph. (Scale: On Y axis, 1 cm = 4 animals).
AnimalsDeerTigerMonkeyRabbitPeacock
Number20412168
View full solution

Generate a Bar Graphs paper free

Pick question groups from the list above, set marks and difficulty, and export a branded PDF with step-by-step answer keys. First 3 chapters free — no signup.

Download App