Question 15 Marks
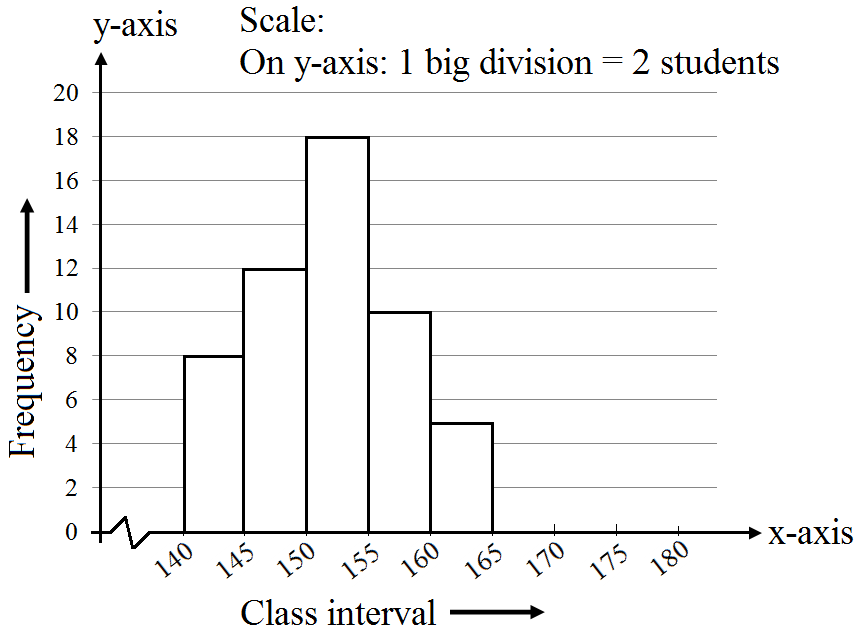
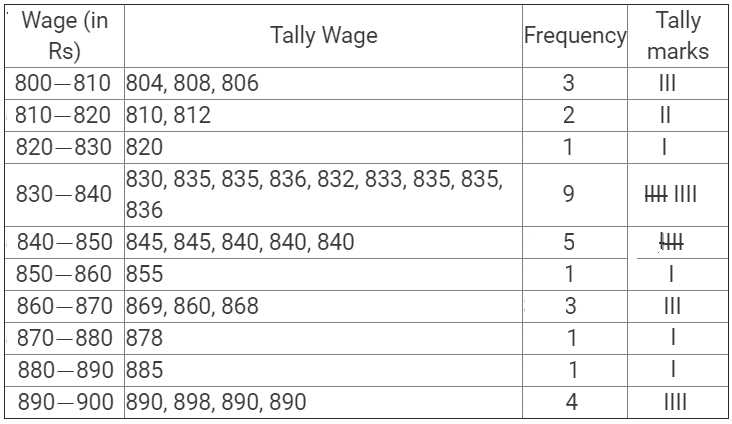
Given below is the frequency distribution of the heights of 50 students of a class:
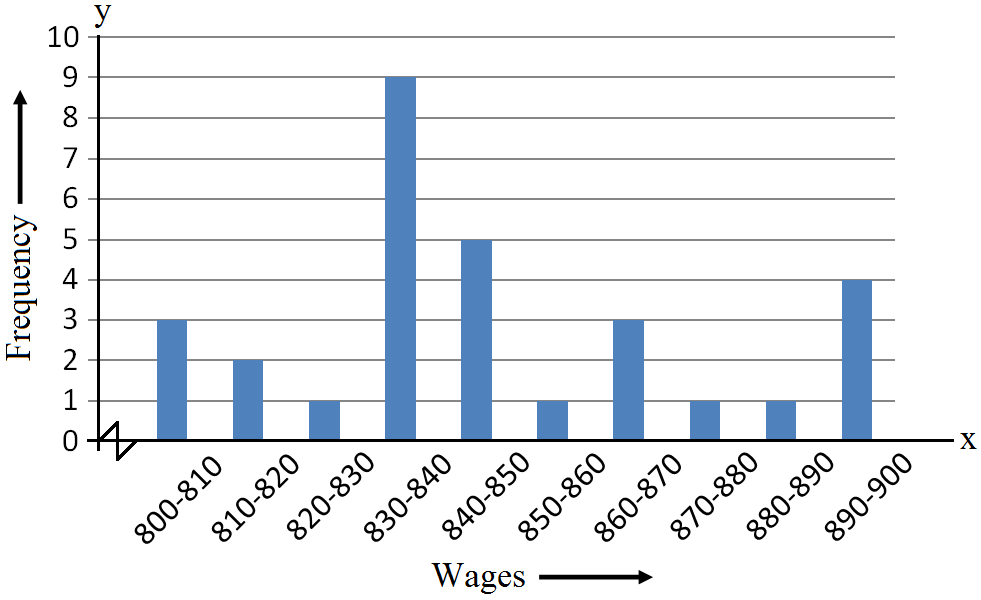
Draw a histogram representing the above data.
|
Class interval
|
140-145
|
145-150
|
150-155
|
155-160
|
160-165
|
|
Frequency
|
8
|
12
|
18
|
10
|
5
|
Answer
View full question & answer→The class limits are represented along the x-axis on a suitable scale and the frequencies are represented along the y-axis on a suitable scale. Taking class intervals as bases and the corresponding frequencies as heights, the rectangles can be constructed to obtain the histogram of the given frequency distribution as shown in the figure below: