Question 14 Marks
The following histogram shows the frequency distribution f the ages of 22 teachers in a school:
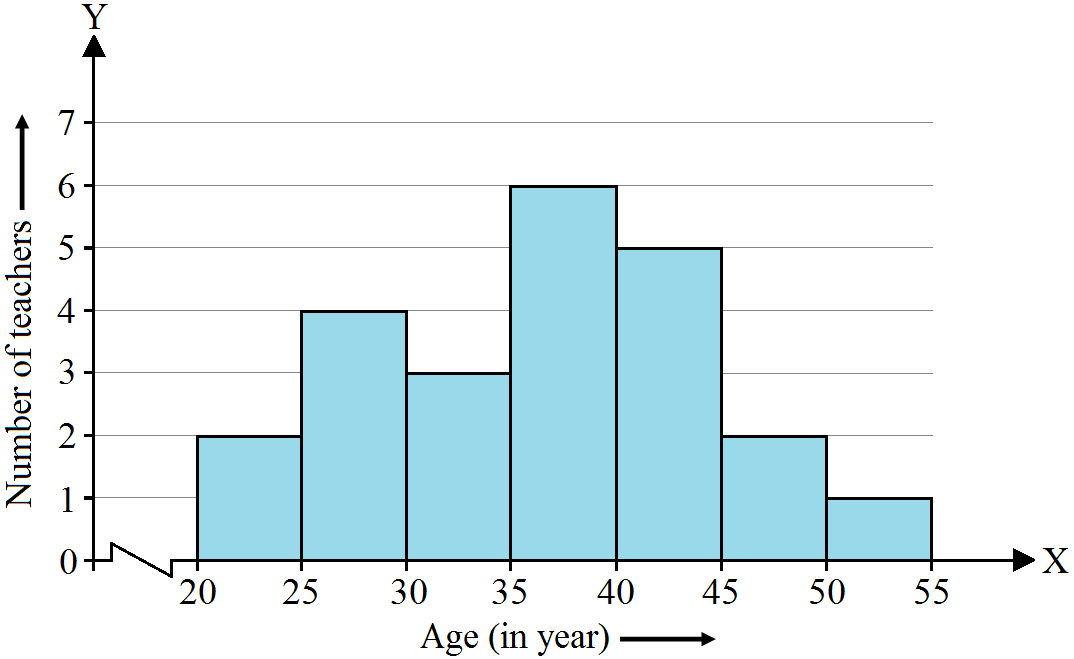
- What is the number of eldest and youngest teachers in the school?
- Which age group teachers are more in the school and which least?
- What is the size of the classes?
- What are the class marks of the classes?
Answer
The youngest (20-25 years) = 2 persons
This is because the height of the rectangle with class interval 20-25 as base is 2 units.
$\text{Class mark}=\frac{20+25}{2}=\frac{45}{2}=22.5$
Similarly, the class marks of the other classes are 27.5, 32.5, 37.5, 42.5, 47.5, 52.5
View full question & answer→- The eldest (50-55 years) = 1 person
The youngest (20-25 years) = 2 persons
This is because the height of the rectangle with class interval 20-25 as base is 2 units.
- The group containing the most number of teachers is 35-40 years. This is because the height of the rectangle with class interval 35-40 as base is the maximum.
- Class size = The range between the upper and the lower boundaries of the class.
- $\text{Class mark}=\frac{\text{Upper limit }+\text{ Lower limit}}{2}$
$\text{Class mark}=\frac{20+25}{2}=\frac{45}{2}=22.5$
Similarly, the class marks of the other classes are 27.5, 32.5, 37.5, 42.5, 47.5, 52.5