Below is the histogram depicting marks obtained by 43 students of a class:
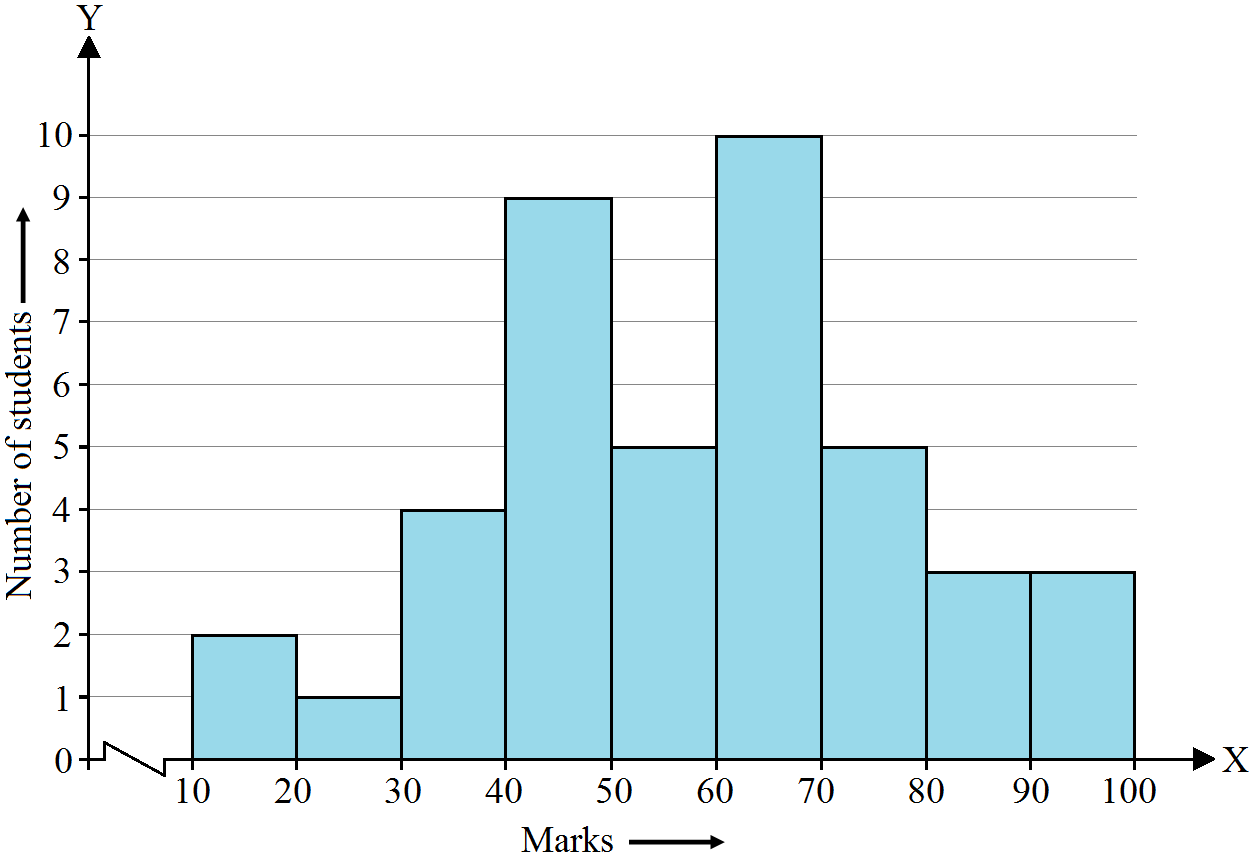
- Write the number of students getting the highest marks.
- What is the class size?
12 questions across 3 question groups — pick any mix to generate a Maths paper with step-by-step answer keys.
One sample from each question group in this chapter. Select any group above to see the full set with answer keys.
|
Class interval
|
140-145
|
145-150
|
150-155
|
155-160
|
160-165
|
|
Frequency
|
8
|
12
|
18
|
10
|
5
|
| Year | No. of workshops |
| 1995-1996 | 25 |
| 1996-1997 | 30 |
| 1997-1998 | 42 |
| 1998-1999 | 50 |
| 1999-2000 | 65 |
|
Daily earnings (in Rs.)
|
450-500
|
500-550
|
550-600
|
600-650
|
650-700
|
|
Numbers of stores
|
16
|
10
|
7
|
3
|
1
|
|
Monthly salary (in Rs.)
|
Number of teachers
|
|
5600-5700
|
8
|
|
5700-5800
|
4
|
|
5800-5900
|
3
|
|
5900-6000
|
5
|
|
6000-6100
|
2
|
|
6100-6200
|
3
|
|
6200-6300
|
1
|
|
6300-6400
|
2
|
|
Monthly school fee (in Rs.)
|
30-60
|
60-90
|
90-120
|
120-150
|
150-180
|
180-210
|
210-240
|
|
Number of schools
|
5
|
12
|
14
|
18
|
10
|
9
|
4
|
Pick question groups from the list above, set marks and difficulty, and export a branded PDF with step-by-step answer keys. First 3 chapters free — no signup.