MCQ 1511 Mark
The median of the numbers $4, 4, 5, 7, 6, 7, 7, 12, 3$ is:
AnswerArranging the points in an ascending order,
We have:
$3, 4, 4, 5, 6, 7, 7, 7, 12$
Here, $n = 9$, Which is odd
$\therefore\ $median score = value of $\frac{1}{2}(9+1)^\text{th}$ terms
= value of $\Big(\frac{1}{2}\times10\Big)^\text{th}$ term
= value of 5$^{th}$ term
= $6$
View full question & answer→MCQ 1521 Mark
The class marks of a frequency distribution are given as follows $15, 20, 25$ the class corresponding to the class mark $20$ is:
- A
$18.5 - 21.5$
- B
$19.5 - 20.5$
- C
$12.5 - 17.5$
- ✓
$17.5 - 22.5$
AnswerCorrect option: D. $17.5 - 22.5$
Clearly, lower limit of the class corrseponding to class mark $20$
$=\frac{\text{Class mark of precending class + 20}}{2}$
$=\frac{15+20}{2}=17.5$
Uppar limit of the class corresponding to the class mark $20$
$=\frac{\text{20 + Class mark of succeending class}}{2}$
$=\frac{20+25}{2}=\frac{45}{2}=22.5$
Hence the required class is $17.5 - 22.5$.
View full question & answer→MCQ 1531 Mark
If $x$ is the mean of $x_1, x_2, \ldots, x_n$ then for $\text{a}\neq0,$ the mean of $\text{ax}_1,\ \text{ax}_2,\ ...,\ \text{ax}_\text{n},\ \frac{\text{x}_1}{\text{a}},\ \frac{\text{x}_2}{\text{a}},\ ...,\ \frac{\text{x}_\text{n}}{\text{a}}$ is:
- A
$\frac{\Big(\text{a}+\frac{1}{\text{a}}\Big)\bar{\text{x}}}{2\text{n}}$
- ✓
$\Big(\text{a}+\frac{1}{\text{a}}\Big)\frac{\bar{\text{x}}}{2}$
- C
$\Big(\text{a}+\frac{1}{\text{a}}\Big)\frac{\bar{\text{x}}}{\text{n}}$
- D
$\Big(\text{a}+\frac{1}{\text{a}}\Big)\bar{\text{x}}$
AnswerCorrect option: B. $\Big(\text{a}+\frac{1}{\text{a}}\Big)\frac{\bar{\text{x}}}{2}$
Mean of $a x_1, a x_2, \ldots, a x_n$, is $\text{a}\bar{\text{x}}$
Mean of $\frac{\text{x}_1}{\text{a}},\ \frac{\text{x}_2}{\text{a}},\ ...,\ \frac{\text{x}_\text{n}}{\text{a}}$ is $\frac{1}{\text{a}}\bar{\text{x}}$
so the their mean is $\Big(\text{a}+\frac{1}{\text{a}}\Big)\frac{\bar{\text{x}}}{2}.$
View full question & answer→MCQ 1541 Mark
In the class intervals $10-20, 20-30,$ the number $20$ is included in:
AnswerCorrect option: B. $20-30$
This is the continuous from of frequency distribution.
Here, the upper limit of each class is excluded, while the lower limit is included.
So, the number $20$ is included in the class interval $20-30$.
View full question & answer→MCQ 1551 Mark
A grouped frequency table with class intervals of equal sizes using $250-270$ ($270$ not included in this interval) as one of the class interval is constructed for the following data : $268, 220, 368, 258, 242, 310, 272, 342, 310, 290, 300, 320, 319, 304, 402, 318, 406, 292, 354, 278, 210, 240, 330, 316, 406, 215, 258, 236$. The frequency of the class $310-330$ is:
AnswerThe class interval is $250 - 270, 270$ not included.
It means that the class is continuous.
Also, the data can be tabulated as follows:
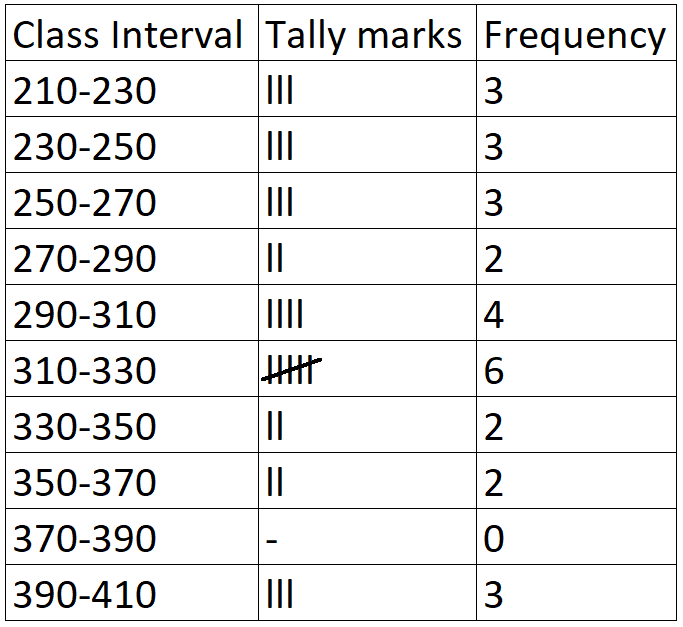
Thus, frequency of the class $310 - 330$ is $6$ as can be seen from the table. View full question & answer→MCQ 1561 Mark
$A, B, C$ are three sets of values of $x$:
$A: 2, 3, 7, 1, 3, 2, 3$
$B: 7, 5, 9, 12, 5, 3, 8$
$C: 4, 4, 11, 7, 2, 3, 4$
Which one of the following statements is correct? - A
Mean of $A$ = Mode of $C$
- B
Mean of $C$ = Median of $B$
- C
Median of $B$ = Mode of $A$
- ✓
Mean, Median and Mode of $A$ are equal.
AnswerCorrect option: D. Mean, Median and Mode of $A$ are equal.
$A: 1, 2, 2, 3, 3, 3, 7$
$B: 3, 5, 5, 7, 8, 9, 12$
$C: 2, 3, 4, 4, 4, 7, 11$
$\text{Mean of A}=\frac{1+2+2+3+3+3+7}{7}$
$=\frac{21}{7}=3$
$\text{Mean of B}=\frac{3+5+5+7+8+9+12}{7}$
$=\frac{49}{7}=7$
$\text{Mean of C}=\frac{2+3+4+4+4+7+11}{7}$
$=\frac{35}{7}=5$
Mode of $A = 3$; Median of $A = 3$
Mode of $B = 5$; Median of $B = 7$
Mode of $C = 4$; Median of $C = 4$
(Mean of $A = 3$) $\neq$ (Mode of $C = 4$)
(Mean of $C = 5$) $\neq$ (Median of $B = 4$)
(Median of $B = 7$) $\neq$ (Mode of $A = 3$)
Mean of $A = 3$, Mode of $A = 3$, Median of $A = 3$ View full question & answer→MCQ 1571 Mark
A set of data consists of six numbers: $7, 8, 8, 9, 9$ and $x$. The difference between the modes when $x = 9$ and $x = 8$ is:
AnswerThe mode in a list of numbers refers to the integers that occurs most number of times.
In the given list both $8$ and $9$ occur two times.
So the value of will decide the mode
If $x = 8$, then mode will be $8$
If $x = 9$, then mode will be $9$
Hence, differnce between two modes is $1$.
View full question & answer→MCQ 1581 Mark
The mean of $n$ observations is $x$ If the first item is increased by $1$, second by $2$, third by $3$ and so on, then the new mean is:
- ✓
$\text{x}+\frac{\text{n}+1}{2}$
- B
$\text{x}+\frac{\text{n}}{2}$
- C
$\text{x}+\frac{\text{n}(\text{n}+1)}{2}$
- D
$\text{x}+\text{n}$
AnswerCorrect option: A. $\text{x}+\frac{\text{n}+1}{2}$
If the first item is increased by $1$, second by $2$, third by $3$ and so on,
So the new sequence thus formed is $x_1+1, x_2+2, x_3+3 \ldots \ldots x_n+n$
So the new mean is increased by $\frac{\text{n}+1}{2}$
So the new mean is $\text{x}+\frac{\text{n}+1}{2}$
Where $x$ is the mean of first $n$ numbers.
View full question & answer→MCQ 1591 Mark
The given data is $3, 5, 6, 7, 5, 4, 7, 5, 6, x, 8$ and $7$. Then the value of $x$ for which the mode of the above data will be $7$, is:
AnswerThe mode in a list of numbers refers to the integers that occur most number of times.
In the given list $5$ occur three times and $7$ occurs three times.
For $7$ to be mode of the list it should occur more number of times than any other number
So $x$ should be $7$.
Mode $= 7$
View full question & answer→MCQ 1601 Mark
Write the correct answer in the following: There are $50$ numbers. Each number is subtracted from $53$ and the mean of the numbers so obtained is found to be $-3.5$. The mean of the given numbers is:
- A
$46.5$
- B
$49.5$
- C
$53.5$
- ✓
$56.5$
AnswerCorrect option: D. $56.5$
Given, $n = 50$, then mean $\bar{\text{x}}=\frac{\sum\limits^{\text{n}}_{\text{i}=1}\text{x}_\text{i}}{\text{n}}$
Then, $\bar{\text{x}}=\frac{1}{50}\times\sum\limits^{50}_{\text{i}=1}\text{x}_\text{i}$
$\Rightarrow\sum\limits^{50}_{\text{i}=1}\text{x}_\text{i}=50\bar{\text{x}}$
Now, subtract each observation from $53$, we get a new mean say $\bar{\text{x}}_\text{new}$
$\therefore\ \bar{\text{x}}_\text{new}=\frac{(-\text{x}_1+53)+(-\text{x}_2+53)\ +\ .....\ +(-\text{x}_{50}+53)}{50}$
$\Rightarrow-3.5=\frac{-(\text{x}_1+\text{x}_2\ +\ .....\ +\text{x}_{50})+(53+53\ +\ ....\ +50\text{times})}{50}$
$\Rightarrow-3.5\times50=(-\text{x}_1+\text{x}_2+\ ....\ +\text{x}_{50})+53\times50$
$\therefore$ Mean of $50$ observation $=\frac{1}{50}\sum\limits^{50}_{\text{i}=1}\text{x}_{\text{i}}$
$=\frac{1}{50}\times2852=56.5$ $\Bigg[\because\text{ mean}=\frac{\sum\limits^{\text{n}}_{\text{i}=1}\text{x}_\text{i}}{\text{n}}\Bigg]$
Hence, the mean of given number is $56.5$.
View full question & answer→MCQ 1611 Mark
If the mean of $x, x + 3, x + 5, x + 7, x + 10$ is $9$, the mean of the last three observation is:
- A
$10\frac{1}{3}$
- B
$10\frac{2}{3}$
- ✓
$11\frac{1}{3}$
- D
$11\frac{2}{3}$
AnswerCorrect option: C. $11\frac{1}{3}$
Mean of $5$ observations $= 9$
$\text{Mean}=\frac{\text{Sum of all observations}}{\text{Total number of observation}}$
$\Rightarrow9=\frac{\text{x}+\text{x}+3+\text{x}+5+\text{x}+7+\text{x}+10}{5}$
$\Rightarrow9=\frac{5\text{x}+18}{5}$
$\Rightarrow45=5\text{x}+18$
$\Rightarrow5\text{x}=20$
$\Rightarrow\text{x}=4$
So, the mean of the last three observations
$=\frac{\text{x}+5+\text{x}+7+\text{x}+10}{3}$
$=\frac{4+5+4+7+4+10}{3}$
$=\frac{34}{3}$
$=11\frac{1}{3}$
View full question & answer→MCQ 1621 Mark
Write the correct answer in the following: Let m be the mid-point and $l$ be the upper class limit of a class in a continuous frequency distribution. The lower class limit of the class is:
- A
$2m + l$
- ✓
$2m - l$
- C
$m - l$
- D
$m - 2l$
AnswerCorrect option: B. $2m - l$
Let $x$ and $y$ be the lower and upper class limit of a continuous frequency distribution.
Now, mid-point of a class $=\frac{(\text{x}+\text{y})}{2}=\text{m}$ [given]
$\Rightarrow x + y = 2m = x + l = 2m$
$\big[\therefore$ $y = l =$ upper class limit (given)$\big]$
$\Rightarrow x = 2m - l$
Hence, the lower class limit of the class is $2m - l$.
View full question & answer→MCQ 1631 Mark
The width of each of nine classes in a frequency distribution is $2.5$ and the lower class boundary of the lowest class $10.6$. Then the upper class boundary of the highest class is:
- A
$28.1$
- ✓
$33.1$
- C
$35.6$
- D
$30.6$
AnswerCorrect option: B. $33.1$
Number of classes $= 9$
Lower limit of the lowest class $= 10.6$
Width of each class $= 2.5$
So, Upper limit of the lowest class $= 10.6 + 2.5 = 13.1$
Now, Upper limit of the lowest class + Width of each class = Upper limit of the next class
Thus, we have
Upper limit of the lowest class + $8 \times $ width of each class = Upper limit of the highest ($9$$^{th}$) class
Upper limit of the highest (9$^{th}$) class $= 13.1 + 8 \times 2.5 = 33.1$
View full question & answer→MCQ 1641 Mark
Let $\bar{x}$ be the mean of $x_1, x_2, \ldots, x_n$ and $\bar{y}$ be the mean of $y_1, y_2, \ldots, y_n$. If $\bar{z}$ is the mean of $x_1, x_2, \ldots, x_n, y_1, y_2, \ldots, y_n$ then $\overline{ z }=?$
- A
$(\bar{\text{x}}+\bar{\text{y}})$
- ✓
$\frac{1}{2}(\bar{\text{x}}+\bar{\text{y}})$
- C
$\frac{1}{\text{n}}(\bar{\text{x}}+\bar{\text{y}})$
- D
$\frac{1}{2\text{n}}(\bar{\text{x}}+\bar{\text{y}})$
AnswerCorrect option: B. $\frac{1}{2}(\bar{\text{x}}+\bar{\text{y}})$
Since $\bar{z}$ is the mean of $x_1, x_2, \ldots, x_n, y_1, y_2, \ldots, y_n$
$\overline{ z }=\frac{\left( x _1+ x _2+\ldots+ x _{ n }\right)+\left( y _1+ y _2+\ldots y _{ n }\right)}{2 n }$
Since $\overline{ x }$ is the mean of $x _1, x _2, \ldots, x _{ n }$,
$\overline{ x }=\frac{ x _1+ x _2+\ldots+ x _{ n }}{ n }$
$\Rightarrow x _1+ x _2+\ldots+ x _{ n }= n \overline{ x }$
Since $\bar{y}$ is the mean of $y_1, y_2, \ldots, y_n$,
$\overline{ y }=\frac{ y _1+ y _2+\ldots+ y _{ n }}{ n }$
$\Rightarrow y _1+ y _2+\ldots+ y _{ n }= n \overline{ y }$
so,
$\overline{ z }=\frac{ n \overline{ x }}{2 n }+\frac{ n \overline{ y }}{2 n }=\frac{ n \overline{ x }+ n \overline{ y }}{2 n }$
$=\frac{\overline{ x }+\overline{ y }}{2}$
View full question & answer→MCQ 1651 Mark
Write the correct answer in the following: If each observation of the data is increased by $5$, then their mean:
AnswerCorrect option: D. Is increased by $5$.
Let $x_1, x_2, \ldots, x_n$ be the $n$ observation,
Then, old mean $\bar{\text{x}}_{\text{old}}=\frac{\sum\limits_{\text{i}=1}^\text{n}\text{x}_\text{i}}{\text{n}}\ \dots(\text{i})$
Now, adding $5$ in each obsevation, the new mean becomes
$\bar{\text{x}}_{\text{new}}=\frac{(\text{x}_1+5)+(\text{x}_2+5)+\ ...\ +(\text{x}_\text{n}+5)}{\text{n}}$
$\Rightarrow\ \bar{\text{x}}_{\text{new}}=\frac{(\text{x}_1+\text{x}_2+\ ...\ +\text{x}_\text{n})+5\text{n}}{}$
$\Rightarrow\ \bar{\text{x}}_{\text{new}}=\frac{\sum\limits_{\text{i}=1}^\text{n}\text{x}_\text{i}}{\text{n}}+5=\bar{\text{x}}_{\text{old}}+5$ [from Eq. $(i)$]
$\Rightarrow\ \bar{\text{x}}_\text{new}=\bar{\text{x}}_{\text{old}}+5$
Hence, the new mean is increased by $5$.
View full question & answer→MCQ 1661 Mark
To draw a histogram to represent the following frequency distribution:
|
Class interval
|
$5-10$
|
$10-15$
|
$15-25$
|
$25-45$
|
$45-75$
|
|
Frequency
|
$6$
|
$12$
|
$10$
|
$8$
|
$15$
|
The adjusted frequency for the class $25-45$ is: AnswerAdjusted Frequency $=\Big(\frac{\text{Frequncey of the class }}{\text{widthof the class}}\Big)\times5$
Therefore adjusted frequencey of $25-45=\frac{8}{20}\times5=2$
View full question & answer→MCQ 1671 Mark
Tally marks are used to find:
AnswerTally marks are used to find the frequencies.
Hence, the correct choice is $(c)$.
View full question & answer→MCQ 1681 Mark
In a bar graph, the widths of bars:
- A
Are proportional to the corresponding heights.
- B
Are proportional to the corresponding frequencies.
- C
Are proportional to the space between two consecutive bars.
- ✓
AnswerBar graph is a pictorial representation of data variables($x$-axis versus it value on $y$-axis) height of the bar.
Hence width of bar has no significance in bar graph.
View full question & answer→MCQ 1691 Mark
The mean for counting numbers through $100$ is:
- A
$51$
- B
$55.5$
- ✓
$50.5$
- D
$49.5$
AnswerCorrect option: C. $50.5$
Mean of n natural numbers is $\frac{(\text{n+1})}{2}$ So
Mean of $100$ numbers $=\frac{100+1}{2}$
Mean of $100$ numbers $=\frac{100}{2}=50.5$
View full question & answer→MCQ 1701 Mark
The abscissa of the point of intersection of the less than type and of the more than type ogives of a grouped data gives its:
AnswerThe abscissa of the point of intersection of the less than type and of the more than type ogives of a grouped data gives its Median. Since the point of intersection of the more than type ogive and less than type ogive gives the median on the $x$-axis.
View full question & answer→MCQ 1711 Mark
Out of sixteen observations arranged in an ascending order, the $8$$^{th}$ and $9$$^{th}$ observations are $25$ and $27$. Then, the median is:
AnswerThe median is the middle score for a set of data that has been arranged in ascending or descending order of magnitude.
If the number of observation is even (as in this example), then the median is the average of two middle numbers
Hence, the average of $25$ and $27$ is $\frac{25+27}{2}=26$
So the median is $26$.
View full question & answer→MCQ 1721 Mark
The mean of n observations is $\overline{\text{X}}.$ If k is added to each observation, then the new mean is:
- A
$\overline{\text{X}}$
- ✓
$\overline{\text{X}}+\text{k}$
- C
$\overline{\text{X}}-\text{k}$
- D
$\text{k}\overline{\text{X}}$
AnswerCorrect option: B. $\overline{\text{X}}+\text{k}$
$\text{Mean}=\overline{\text{X}}=\frac{\text{Sum of all observations}}{\text{Total number of observations}}$
$=\frac{\text{Sum of all observations}}{\text{n}}$
Now if k is aded to each observation
$\text{New Mean},\overline{\text{X'}}=\frac{\text{Sum of all observations}+\text{nk}}{\text{n}}$
$=\frac{\text{Sum of all observations}}{\text{n}}+\text{k}$
$\Rightarrow\overline{\text{X}'}=\overline{\text{X}}+\text{k}$
View full question & answer→MCQ 1731 Mark
Class mark of a particular class is $9.5$ and the class size is $6$, then the class interval is:
- ✓
$6.5 - 12.5$
- B
$15.5 - 27.5$
- C
$3.5 - 15.5$
- D
$12.5 - 18.5$
AnswerCorrect option: A. $6.5 - 12.5$
Class mark $=\frac{\text{upper limit+lower limit}}{2}$
$2 \times 9.5$ = upper limit + lower limit
$19$ = upper limit + lower limit
Class size = upper limit - lower limit
$6$ = upper limit - lower limit
Solving above two equations we get,
$2 \times $ upper limit $= 25$
upper limit $= 12.5$
Hence, lower lower limit $= 12.5 - 6 = 6.5$
So, the class interval is$ 6.5 - 12.5$.
View full question & answer→MCQ 1741 Mark
In a histogram the class intervals or the groups are taken along:
AnswerCorrect option: A. $X$-axis.
Histogram states that a two dimensional frequency density diagram is called as a histogram. The histograms are diagrams which represent the class interval and the frequency in the form of a rectangle. There will be as many adjoining rectangles as there are class intervals.
View full question & answer→MCQ 1751 Mark
The difference between the mean and median of first five prime numbers is:
AnswerFirst five prime numbers are $2, 3, 5, 7, 11$
Mean is $\frac{2+3+5+7+11}{5}$
$\frac{28}{5}=5.6$
Median is $5$
So the difference between them is $5.6 - 5 = 0.6$
View full question & answer→MCQ 1761 Mark
The mean of five numbers is $30$. If one number is excluded, their mean becomes $28$. The excluded number is:
AnswerLet $a, b, c, d$ and $e$ are five numbers, then
Mean $=\frac{\text{(a + b + c + d + e)}}{5}=30$
$\Rightarrow (a + b + c + d + e) = 150 ..... (1)$
Now Let the number excluded be a
Then new mean $=\frac{\text{(b + c + d + e)}}{4}=28$
$\Rightarrow (b + c + d + e) = 112$
Putting this value in $(1)$
$\Rightarrow a + 112 = 150$
$\Rightarrow a = 150 - 112 = 38$
$\therefore$ Excluded number $= 38$
View full question & answer→MCQ 1771 Mark
Write the correct answer in the following: If the mean of the observations: $x, x + 3, x + 5, x + 7, x + 10$ is $9$, the mean of the last three observations is:
- A
$10\frac{1}{3}$
- B
$10\frac{2}{3}$
- ✓
$11\frac{1}{3}$
- D
$11\frac{2}{3}$
AnswerCorrect option: C. $11\frac{1}{3}$
Given that, the mean of the observation $x, x + 3, x + 5, x + 7$ and $x + 10$ is $9$.
$\therefore\ \frac{\text{x}+\text{x}+3+\text{x}+5+\text{x}+7+\text{x}+10}{5}=9$
$\Rightarrow {\text{5x}}+25=45$
$\Rightarrow\text{5x}=20$
$\Rightarrow \text{x}=4$
$\therefore$ Last three odservations are $x + 5 = 4 + 5 = 9, x + 7 = 4 + 7 = 11$
and $x + 10 = 4 + 10 = 14$
So, the mean of last three observations $=\frac{9+11+14}{3}=\frac{34}{3}=11\frac{1}{3}$
Hence, the mean of last three observation is $11\frac{1}{3}.$
View full question & answer→MCQ 1781 Mark
There are $50$ numbers. Each number is subtracted from $53$ and the difference between the mean of the numbers so obtained is found to be $3.5$. The mean of the given number is:
- ✓
$56.5$
- B
$52.5$
- C
$49.5$
- D
$47.5$
AnswerCorrect option: A. $56.5$
Let the mean of the initial sequence is $x$.
Given that, after subtracting $53$ from each number, the difference between the means is $3.5$.
So, $x - 53 = 3.5$
Mean of the number is $x = 53 + 3.5 = 56.5$
View full question & answer→MCQ 1791 Mark
Find out the mode of the following: $5, 4, 3, 5, 6, 6, 6, 5, 4, 5, 5, 3, 2, 1$.
AnswerThe observation which occurs maximum number of times is called the mode of the given data.
Above given data has a maximum number of $5$, so the mode is $5$.
View full question & answer→MCQ 1801 Mark
$A, B, C$ are three sets of values of $x;$
$A. 2, 3, 7, 1, 3, 2, 3$
$B. 7, 5, 9, 12, 5, 3, 8$
$C. 4, 4, 11, 7, 2, 3, 4$
Which one of the following statements is correct?
- A
Median of $B =$ Mode of $A$.
- B
Mean of $A =$ Mode of $C$.
- ✓
Mean, Median and Mode of $A$ are equal.
- D
Mean of $C =$ Median of $B$.
AnswerCorrect option: C. Mean, Median and Mode of $A$ are equal.
For the data $A: 2, 3, 7, 1, 3, 2, 3,$ of $7$ numbers, we have
Mean $=\frac{2+3+7+1+3+2+3}{7}=\frac{21}{7}=3$
Arranging the data $A$ in ascending orer we have
$A: 1, 2, 2, 3, 3, 3, 7$
Median $=\Big(\frac{7+1}{2}\Big)^\text{th}$ Value
$= 4^{th}$ value $= 3$
Since, $3$ occurs maximum number of times, Mode $= 3$
Mean $=$ Median $=$ Mode
View full question & answer→MCQ 1811 Mark
In a frequency distribution, the mid-value of a class is $15$ and the class intervals is $4$. The lower limit of the class is:
AnswerLet the lower limit be $x$.
Class interval $= 4$
Upper limit $= x + 4$
Now, mid - value of a class $=\frac{\text{x}+4+\text{x}}{2}=\text{x}+2=15(\text{given)}$
$x = 13 =$ lower limit
View full question & answer→MCQ 1821 Mark
N a histogram the area of each rectangle is proportional to:
- A
The class size of the corresponding class interval.
- B
Cumulative frequency of the corresponding class interval.
- ✓
Frequency of the corresponding class interval.
- D
The class mark of the corresponding class interval.
AnswerCorrect option: C. Frequency of the corresponding class interval.
A histogram is a display of statistical information that uses rectangles to show the frequency of data items in successive numerical intervals of equal size. In the most common form of histogram, the independent variable is plotted along the horizontal ax is and the dependent variable is plotted along the vertical ax is.
View full question & answer→MCQ 1831 Mark
In the class intervals $10-20, 20-30, 20$ is taken in:
AnswerCorrect option: B. The interval $20-30$.
The given class intervals are $10-20, 20-30$. In these class intervals the value $20$ is lies in the class interval $20-30$.Hence, the correct choice is $(b)$.
View full question & answer→MCQ 1841 Mark
Write the correct answer in the following: Mode of the data $15, 14, 19, 20, 14, 15, 16, 14, 15, 18, 14, 19, 15, 17, 15$ is:
AnswerWe first arrange the given data in ascending order as follows $14, 14, 14, 14, 15, 15, 15, 15, 15, 16, 17, 18, 19, 19, 20$ From above, we see that $15$ occurs most frequently i.e., $5$ times.
View full question & answer→MCQ 1851 Mark
Let $L$ be the lower class boundary of a class in a frequency distribution and m be the midpoint of the class. Which one of the following is the upper class boundary of the class?
AnswerCorrect option: D. $2\text{m}-\text{L}$
Mid - value $=\frac{\text{Lower limit + Upper limit}}{2}$
$\Rightarrow\text{m}=\frac{\text{L+U}}{2}$
$\Rightarrow U = 2m - L$
$\therefore$ Upper class boundary of the class $= 2m – L$
View full question & answer→MCQ 1861 Mark
The mean of a set of seven numbers is $81$. If one of the numbers is discarded, the mean of the remaining numbers is $78$. The value of discarded number is:
Answer$\text{Mean}=81=\frac{\text{Sum of seven numbers}}{7}$
$\Rightarrow $ Sum of seven numbers $= 81 \times 7 = 567$.
Let the discared number be $x$.
$\Rightarrow $ Sum of $6$ numbers $= 567 - x$
Now, mean of remaining $6$ numbers $=\frac{567-\text{x}}{6}=78$
$\Rightarrow 567 - x = 468$
$\Rightarrow x = 99$
So, discarded number is $99$.
View full question & answer→MCQ 1871 Mark
A histogram is a pictorial representation of the grouped data in which class intervals and frequency are respectively taken along:
- A
- B
Vertical axis and horizontal axis.
- ✓
Horizontal axis and vertical axis.
- D
AnswerCorrect option: C. Horizontal axis and vertical axis.
Correct option is $(c)$.
A histogram is a pictorial representation of the grouped data in which class interval and frequency are respectively taken along horizontal axis and vertical axis.
View full question & answer→MCQ 1881 Mark
The marks obtained by $10$ students in a mathematics test are $75, 90, 70, 50, 70, 50, 75, 90, 70$ and $75$. Their median mark is:
AnswerCorrect option: B. $72.5$
The median is the middle value for a set of data that has been arranged in ascending or descending order of magnitude.
Arrange the given observations in ascending order $50, 50, 70, 70, 70, 75, 75, 75, 90, 90$
Here two numbers $70$ and $75$ are in the middle.
So, median is average of $70$ and $75$
$=\frac{70+75}{2}=72.5\text{ i..e }72.5$
View full question & answer→MCQ 1891 Mark
If the mean of five observations $x, x + 2, x + 4, x + 6$ and$ x + 8$ is $11$ then the value of $x$ is:
AnswerMean of $5$ observations $= 11$
We know:
Mean $=\frac{\text{Sum of all observations}}{\text{Total number of observations}}$
$\Rightarrow 11=\frac{\text{x}+\text{x}+2+\text{x}+4+\text{x}+6+\text{x}+8}{5}$
$\Rightarrow11=\frac{\text{5x+20}}{5}$
$\Rightarrow 5x + 20 = 55$
$\Rightarrow 5x = 35$
$\Rightarrow x = 7$
View full question & answer→MCQ 1901 Mark
In the 'less than' type of ogive the cumulative frequency is plotted against:
- A
The lower limit of the concerned class interval.
- B
The mid-value of the concerned class interval.
- ✓
The upper limit of the concerned class interval.
- D
Any value of the concerned class interval.
AnswerCorrect option: C. The upper limit of the concerned class interval.
In a less than o-give we plot the points with the upper limits of the class as abscissa and the corresponding less than cumulative frequency as ordinates. It is a rising curve.
View full question & answer→MCQ 1911 Mark
The mean of $100$ observations is $50$. If one of the observations which was $50$ is replaced by $150$, the resulting mean will be:
AnswerMean of $100$ observation $= 50$
$\therefore$ Total of $100$ observation $= 100 \times 50 = 5000$.
If one of the observation $50$ is replaced by $150$ than total of new observation is $= 5000 - 50 + 150 = 5100$
Hence the mean of new $100$ observation $=\frac{5100}{100}=51$
View full question & answer→MCQ 1921 Mark
If $x$ is mean of $x_1, x_2, \ldots .$. then for $a \neq 0$, the mean of $a x_1, a x_2, \ldots . a x_n, \frac{x_1}{a}, \frac{x_2}{a}, \ldots \frac{x_n}{a}$, is:
- A
$\Big(\text{a}+\frac{1}{\text{a}}\Big)\text{x}$
- B
$\frac{\Big(\text{a}+\frac{1}{\text{a}}\Big)}{2\text{n}}$
- ✓
$\Big(\text{a}+\frac{1}{\text{a}}\Big)\frac{\text{x}}{2}$
- D
$\Big(\text{a}+\frac{1}{\text{a}}\Big)\frac{\text{x}}{\text{n}}$
AnswerCorrect option: C. $\Big(\text{a}+\frac{1}{\text{a}}\Big)\frac{\text{x}}{2}$
Mean of $a x_1, a x_2, \ldots . a x_n$, is $a x$
Mean of $\frac{\text{x}_1}{\text{a}},\frac{\text{x}_2}{\text{a}},...\frac{\text{x}_n}{\text{a}},$is $\frac{1}{\text{a}}\text{x}$
So the their mean is $\Big(\text{a}+\frac{1}{\text{a}}\Big)\frac{\text{x}}{2}$
View full question & answer→MCQ 1931 Mark
The mid-value of a class interval is $42$. If the class size is $10$, then the upper and lower limits of the class are:
- A
$37$ and $47$
- ✓
$47$ and $37$
- C
$47.5$ and $37.5$
- D
$37.5$ and $47.5$
AnswerCorrect option: B. $47$ and $37$
Let the lower limit of a class $= x$
Class size $= 10$
Upper limit $= x + 10$
Now mid - value $=\frac{\text{x}+10+\text{x}}{2}=\text{x}+5=42(\text{given})$
$x = 37 =$ lower limit
$x + 10 = 47 =$ upper limit
Thus, upper and lower limits are $47, 37$.
View full question & answer→MCQ 1941 Mark
Write the correct answer in the following: The class mark of the class $90-120$ is:
Answer$\text{Class mark }=\frac{\text{Upperlimit + Lowerlimit}}{2}$
$\Rightarrow \text{Class mark}=\frac{90+120}{2}=\frac{210}{2}=105$
View full question & answer→MCQ 1951 Mark
If $\overline{ x }_1, \overline{ x }_2, \ldots, \overline{ x }_{ n }$ are the means of n group with $n _1, n _2, \ldots, n _{ n }$ number of observation respectively then the mean $\overline{ x }$ of all the groups taken together is:
- A
$\sum\limits_{\text{i}=1}^\text{n}\text{n}_\text{i}\bar{\text{x}}_\text{i}$
- B
$\frac{\sum\limits_{\text{i}=1}^\text{n}\text{n}_\text{i}\bar{\text{x}}_\text{i}}{\text{n}^2}$
- ✓
$\frac{\sum\limits_{\text{i}=1}^\text{n}\text{n}_\text{i}\bar{\text{x}}_\text{i}}{\sum\limits_{\text{i}=1}^\text{n}\text{n}_\text{i}}$
- D
$\frac{\sum\limits_{\text{i}=1}^\text{n}\text{n}_\text{i}\bar{\text{x}}_\text{i}}{2\text{n}}$
AnswerCorrect option: C. $\frac{\sum\limits_{\text{i}=1}^\text{n}\text{n}_\text{i}\bar{\text{x}}_\text{i}}{\sum\limits_{\text{i}=1}^\text{n}\text{n}_\text{i}}$
Sum of the terms $=\text{n}_1\bar{\text{x}_1}+\text{n}_2\bar{\text{x}}_2+\ _{\dots},+\text{n}_\text{n}\bar{\text{x}}_\text{n}$
Number of terms $=\text{n}_1+\text{n}_2+\ _{\dots}+\text{n}_\text{n}$
Required mean $=\frac{\sum\limits_{\text{i}=1}^\text{n}\text{n}_\text{i}\bar{\text{x}}_\text{i}}{\sum\limits_{\text{i}=1}^\text{n}\text{n}_\text{i}}$
View full question & answer→MCQ 1961 Mark
The median of the numbers $84, 78, 54, 56, 68, 22, 34, 45, 39, 54$ is:
AnswerArranging the points in an ascending order,
We have:
$22, 34, 39, 45, 54, 56, 68, 78, 84$
Here, $n = 10$, Which is even
$\therefore\ $median = mean of $\Big(\frac{10}{2}\Big)^\text{th}$ and $\Big(\frac{10}{2}+1\Big)^\text{th}$ terms
$=$ mean of $\Big(\frac{10}{2}\Big)^\text{th}$ and $\Big(\frac{12}{2}\Big)^\text{th}$ term
$=$ mean of $5^{th}$ and $6^{th}$ terms
$=\frac{1}{2}(54+54)$
$\frac{1}{2}\times108$
$=54$
View full question & answer→MCQ 1971 Mark
In the given graph, the number of students who scored $60$ or more marks is:
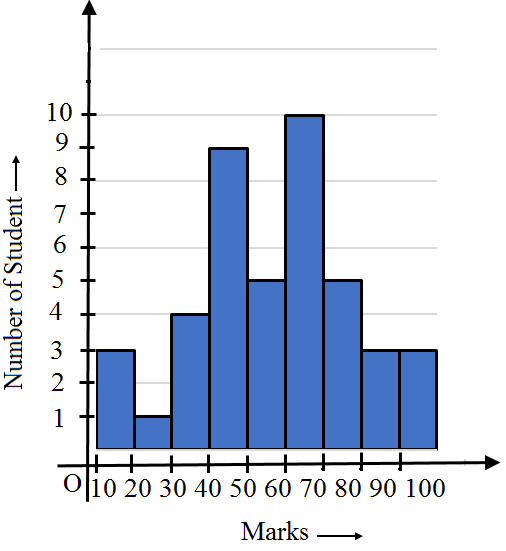
AnswerAdd the values corresponding to the height of the bar from $60$ to $100$
$10 + 5 + 3 + 3 = 21$
View full question & answer→MCQ 1981 Mark
Mode of a set of observations is the value which:
- A
Divides the observations into two equal parts.
- ✓
- C
Is the mean of the middle two observations.
- D
Is the sum of the observations.
AnswerIn statistics, the mode in a list of numbers refers to the integers that occurs most number of times.
View full question & answer→MCQ 1991 Mark
If $\bar{x}$ is the mean of $x_1, x_2, \ldots . ., x_n$, then for $a \neq 0$, then mean of $a x_1, a x_2, \ldots a x_n, \frac{x_1}{a}, \frac{x_2}{a}, \ldots, \frac{x_n}{a}$ is:
- A
$\Big(\text{a}+\frac{1}{\text{a}}\Big)\bar{\text{x}}$
- ✓
$\Big(\text{a}+\frac{1}{\text{a}}\Big)\frac{\bar{\text{x}}}{2}$
- C
$\Big(\text{a}+\frac{1}{\text{a}}\Big)\frac{\bar{\text{x}}}{\text{n}}$
- D
$\frac{\big(\text{a}+\frac{1}{\text{a}}\big)\bar{\text{x}}}{2\text{n}}$
AnswerCorrect option: B. $\Big(\text{a}+\frac{1}{\text{a}}\Big)\frac{\bar{\text{x}}}{2}$
Given, mean of $x_1, x_2, \ldots . ., x_n$ is $\bar{\text{x}}$
$\therefore\ \sum\limits^\text{n}_{\text{i}=1}\text{x}_\text{i}=\text{n}\bar{\text{x}}$
Now, let the mean of $\Big(\text{ax}_1,\text{ax}_2,\ ....\text{ ax}_\text{n},\frac{\text{x}_1}{\text{a}},\frac{\text{x}_2}{\text{a}},\ ...., \ \frac{\text{x}_\text{n}}{\text{a}}\Big)$ is $\bar{\text{z}}$
Then, $\bar{\text{z}}=\frac{(\text{ax}_1,\text{ax}_2,\ ....\text{ ax}_\text{n})+\Big(\frac{\text{x}_1}{\text{a}},\frac{\text{x}_2}{\text{a}},\ ...., \ \frac{\text{x}_\text{n}}{\text{a}}\Big)}{\text{n}+\text{n}}$
$=\frac{\text{a}(\text{x}_1+\text{x}_2+\ ....\ +\text{x}_\text{n})+\frac{1}{\text{a}}(\text{x}_1+\text{x}_2+\ ....\ +\text{x}_\text{n})}{2\text{n}}$
$=\frac{\big(\text{a}+\frac{1}{\text{a}}\big)(\text{x}_1+\text{x}_2+\ ....\ +\text{x}_\text{n})}{2\text{n}}$
$=\frac{\big(\text{a}+\frac{1}{\text{a}}\big)\sum\limits^\text{n}_{\text{i}=1}\text{x}_\text{i}}{2\text{n}}$
$=\frac{\big(\text{a}+\frac{1}{\text{a}}\big)\cdot\text{n}\bar{\text{x}}}{2\text{n}}$
$=\frac{\big(\text{a}+\frac{1}{\text{a}}\big){\bar{\text{x}}}}{2}$
View full question & answer→MCQ 2001 Mark
The width of each of nine classes in a frequency distribution is $2.5$ and the lower class boundary of the lowest class 10.6. Then the upper class boundary of the highest class is:
- A
$35.6$
- ✓
$33.1$
- C
$30.6$
- D
$28.1$
AnswerCorrect option: B. $33.1$
The number of classes is $9$ and the uniform class size is $2.5$.
The lower limit of the lower class (first class) is $10.6$.
Therefore, the upper limit of the last class is
$10.6 + (9 × 2.5)$
$= 10.6 + 22.5$
$= 33.1$
Hence, the correct choice is $(b)$.
View full question & answer→