Question 12 Marks
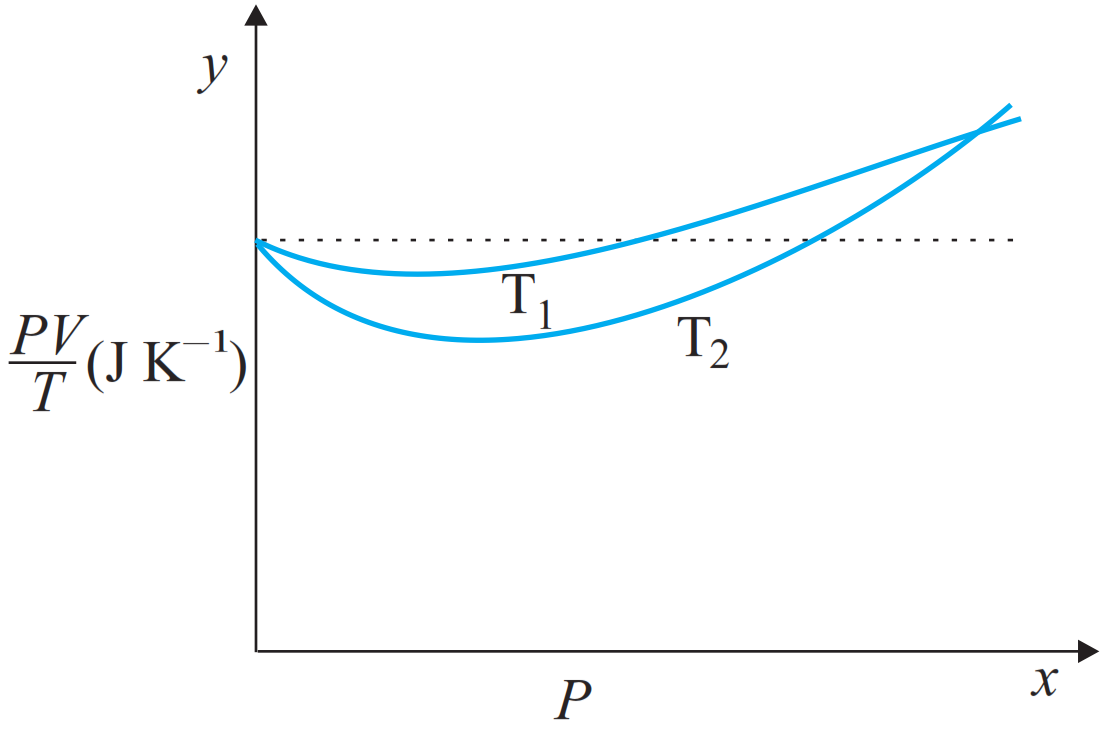
Shows plot of $\frac{\text{PV}}{\text{T}}$ versus P for $1.00 \times 10^{-3} \mathrm{~kg}$ of oxygen gas at two different temperatures. What does the dotted plot signify?

Answer
View full question & answer→The dotted plot in the graph signifies the ideal behaviour of the gas, i.e., the ratio $\frac{\text{PV}}{\text{T}}$ is equal. $\mu\text{R}(\mu$ is the number of moles and R is the universal gas constant) is a constant quality. It is not dependent on the pressure of the gas.

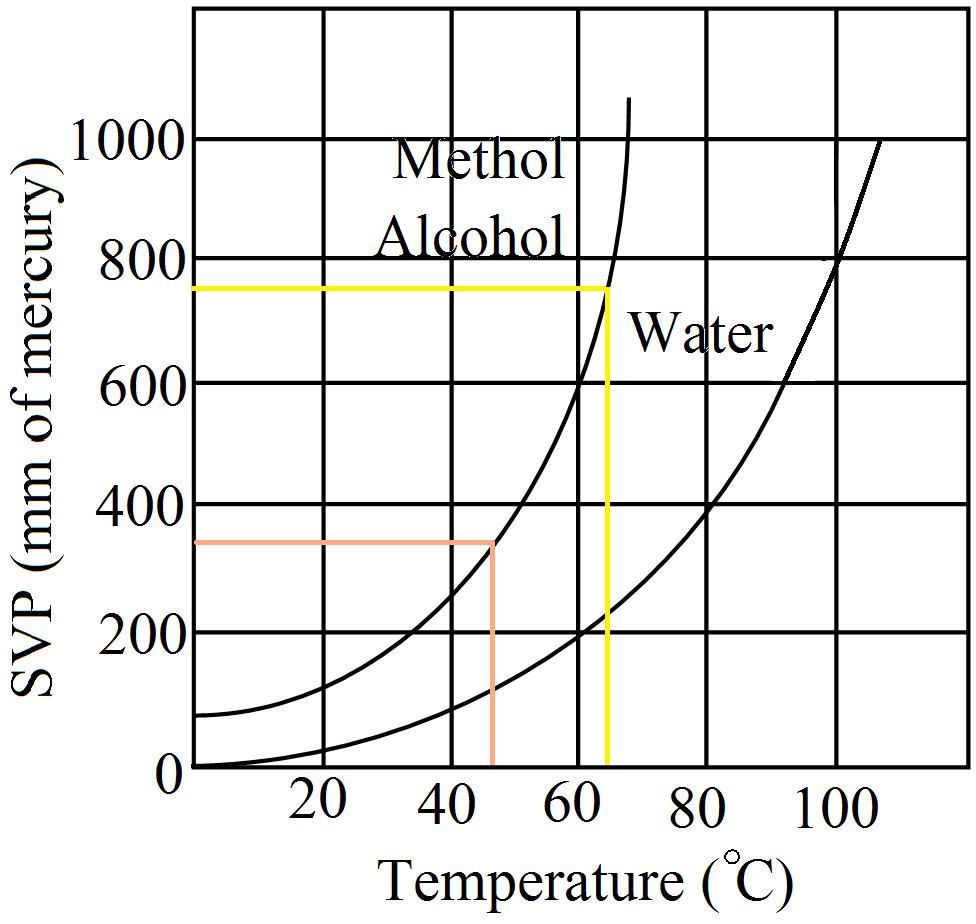
 As this is the max. pressure which the vapours can exert. Hence the normal level of mercury drops down by 0.80cm$\therefore$ The height of the Hg column = 76 - 0.80cm = 75.2cm of Hg. [$\because$ Given SVP at atmospheric temp = 0.80cm of Hg]