Look at the bar graph given below: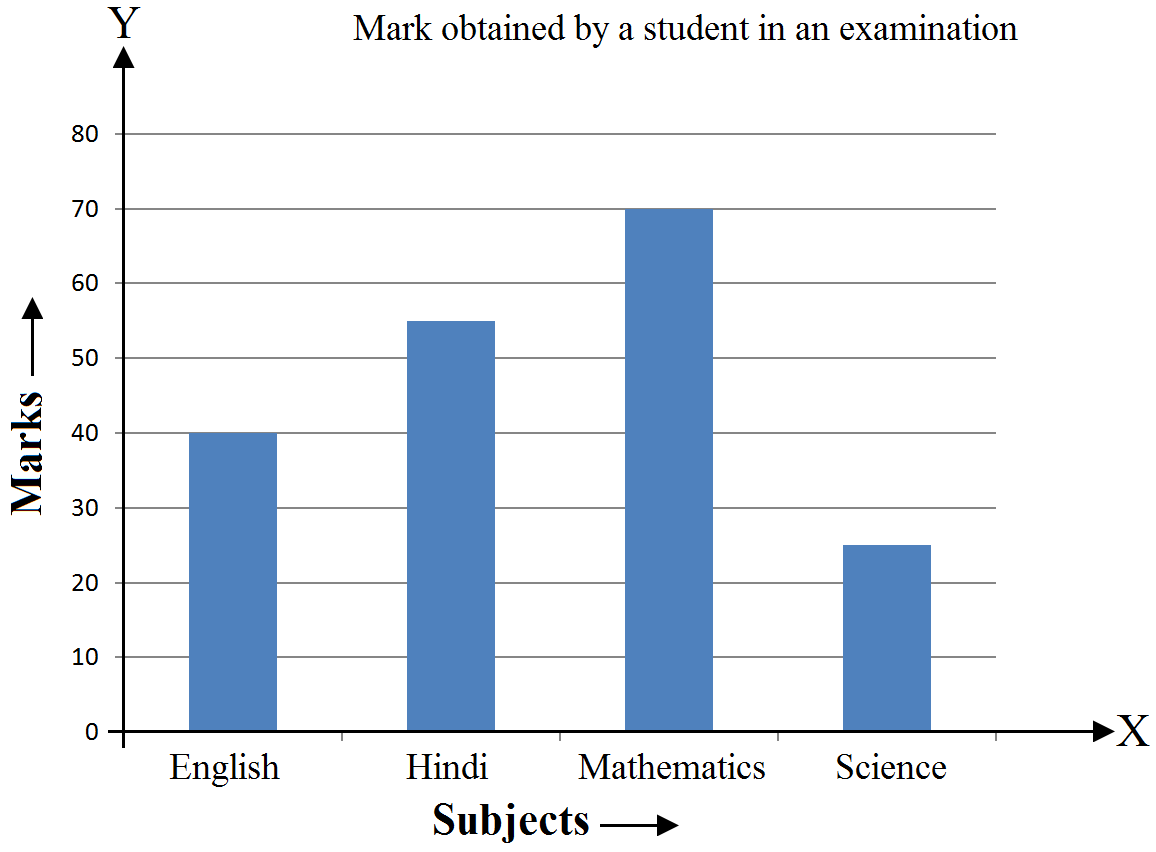
Read it carefully and answer the questions given below:
View full solution →Read it carefully and answer the questions given below:
$i.\ $What information does the bar graph give?
$ii.\ $In which subject is the student poorest?
$iii.\ $In which subject is the student best?
$iv.\ $In which subject did he get more than $40$ marks?