Questions

2 Marks Questions

Take a timed test

2 questions · self-marked practice — reveal the answer and mark yourself.

Question 12 Marks
Look at the bar graph given below:
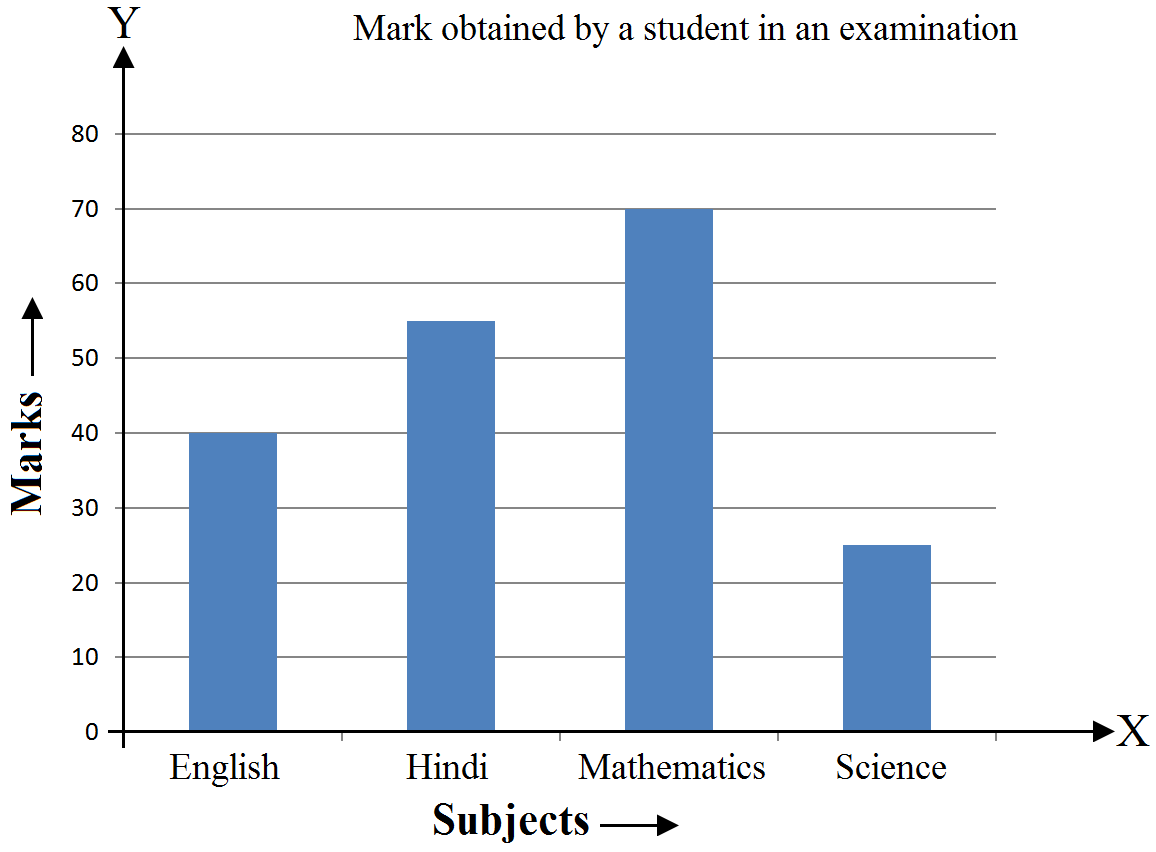
Read it carefully and answer the questions given below:
$i.\ $What information does the bar graph give?
$ii.\ $In which subject is the student poorest?
$iii.\ $In which subject is the student best?
$iv.\ $In which subject did he get more than $40$ marks?
Answer
$i.\ $The given bar graph shows the marks obtained by a student in each of the four subjects in an examination.
$ii.\ $The student is poorest in Science.
$iii.\ $The student is best in Mathematics.
$iv.\ $He got more than $40$ marks in Hindi and Mathematics.
View full question & answer
Question 22 Marks
In a survey of $60$ families of a colony, the number of members in each family was recorded and the data has been represented by the bar graph given below:

Read the bar graph carefully and answer the following questions:
$i.\ $What information does the bar graph give?
$ii.\ $How many families have $3$ members?
$iii.\ $How many couples have no child?
$iv.\ $Which type of family is the most common?
Answer
$i.\ $The given bar graph shows the number of members in each of the $60$ families of a colony.
$ii.\ 10$ families have $3$ members each.
$iii.\ 5$ couples have no child.
$iv.\ $A family of $4$ members is most common.
View full question & answer