Question 12 Marks
Prepare a histogram from the frequency distribution table obtained in question $93$.
View full question & answer→Question 22 Marks
Ritwik draws a ball from a bag that contains white and yellow balls. The probability of choosing a white ball is $\frac{2}{9}.$ If the total number of balls in the bag is $36$. fine the number of yellow balls.
AnswerThe probability of choosing a white ball $=\frac{2}{9}$
Then, the probability of choosing a yellow all $=1-\frac{2}{9}$
$=\frac{9-2}{9}$ $=\frac{7}{9}$
Given, total number of balls in the bag $=36$
$\therefore\ $Number of yellow balls $=\frac{7}{9}\times36$ $=28$
View full question & answer→Question 32 Marks
Following is a pie chart showing the amount spent in rupees $($in thousands$)$ by a company on various modes of advertising for a product. Now answer the following questions.
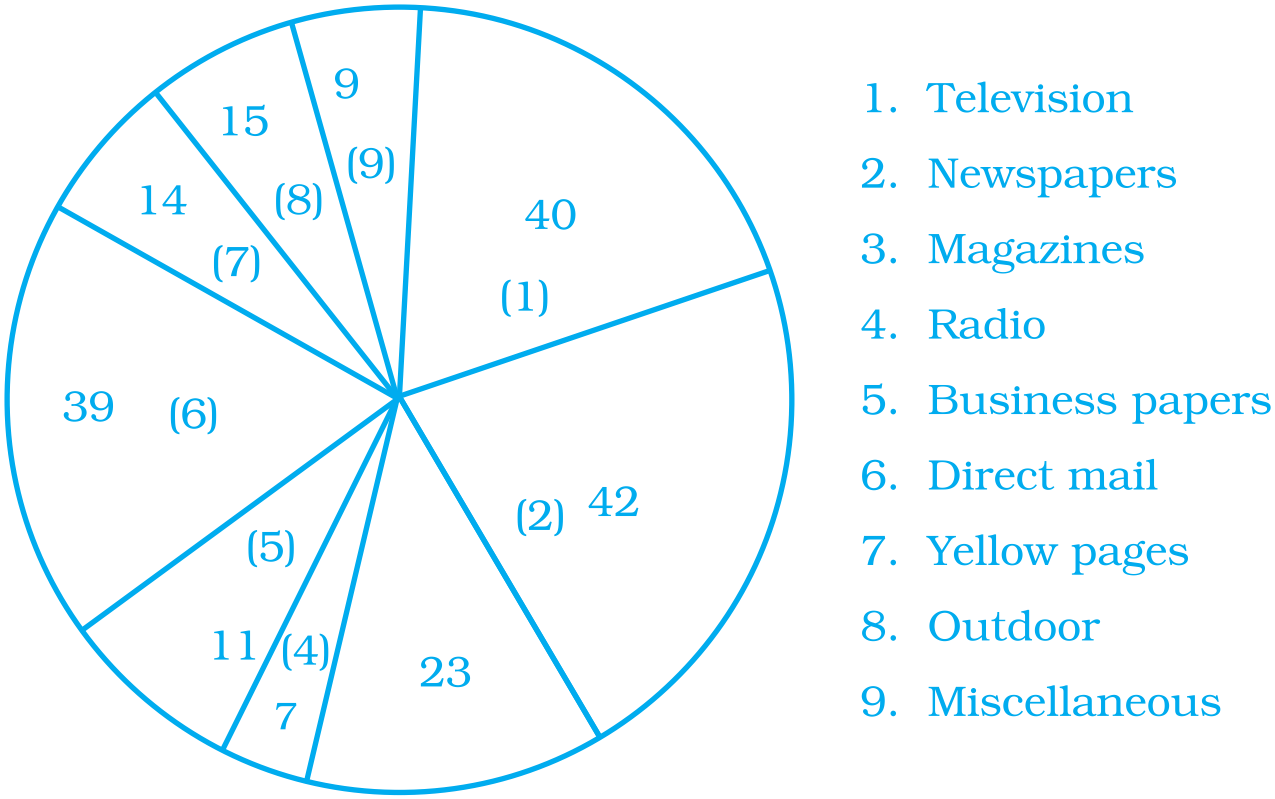
$i.$ Which type of media advertising is the greatest amount of the total?
$ii.$ Which type of media advertising is the least amount of the total?
$iii.$ What per cent of the total advertising amount is spent on direct mail campaigns?
$iv.$ What per cent of the advertising amount is spent on newspaper and magazine advertisements?
$v.$ What media types do you think are included in miscellaneous? Why aren’t those media types given their own category? Answer$i.$ The greatest amount of the total is spent in the advertisement of newspaper, i.e. $Rs. 42$.
$ii.$ The least amount of the total is spent in the advertisement of radio, i.e. $Rs. 7$ thousand.
View full question & answer→Question 42 Marks
The weights $($ in $kg)$ of $30$ students of a class are:
$39, 38, 36, 38, 40, 42, 43, 44, 33, 33, 31, 45, 46, 38, 37, 31, 30, 39, 41, 41, 46, 36, 35, 34, 39, 43, 32, 37, 29, 26$.
Prepare a frequency distribution table using one class interval as $(30-35), 35$ not included.
$i.$ Which class has the least frequency?
$ii.$ Which class has the maximum frequency?
Answer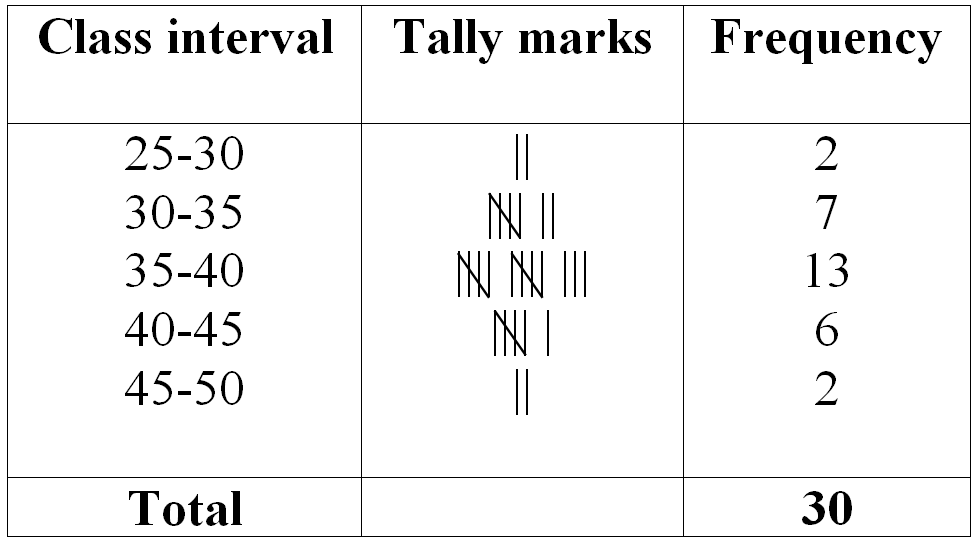
$i.$ The class interval $25-30$ has the least frequency, i.e. $2$.
$ii.$ The class interval $35-40$ has the maximum frequency, i.e. $11$. View full question & answer→Question 52 Marks
Draw a histogram for the following data.
|
Class interval
|
$10-15$
|
$15-20$
|
$20-25$
|
$25-30$
|
$30-35$
|
$35-40$
|
|
Frequency
|
$30$
|
$98$
|
$80$
|
$58$
|
$29$
|
$50$
|
View full question & answer→Question 62 Marks
The marks obtained $($out of $20)$ by $30$ students of a class in a test are as follows: $14, 16, 15, 11, 15, 14, 13, 16, 8, 10, 7, 11, 18, 15, 14, 19, 20, 7, 10, 13, 12, 14, 15, 13, 16, 17, 14, 11, 10, 20$. Prepare a frequency distribution table for the above data using class intervals of equal width in which one class interval is $4-8$ $($excluding $8$ and including $4)$.
View full question & answer→Question 72 Marks
Following are the number of members in $25$ families of a village: $6, 8, 7, 7, 6, 5, 3, 2, 5, 6, 8, 7, 7, 4, 3, 6, 6, 6, 7, 5, 4, 3, 3, 2, 5.$ Prepare a frequency distribution table for the data using class intervals $0-2, 2-4,$ etc.
View full question & answer→Question 82 Marks
The top speeds of thirty different land animals have been organised into a frequency table. Draw a histogram for the given data.
|
Maximum Speed (km/h)
|
Frequency
|
|
$10-20$
|
$5$
|
|
$20-30$
|
$5$ |
|
$30-40$
|
$10$
|
|
$40-50$
|
$8$
|
|
$50-60$
|
$0$
|
|
$60-70$
|
$2$
|
Answer
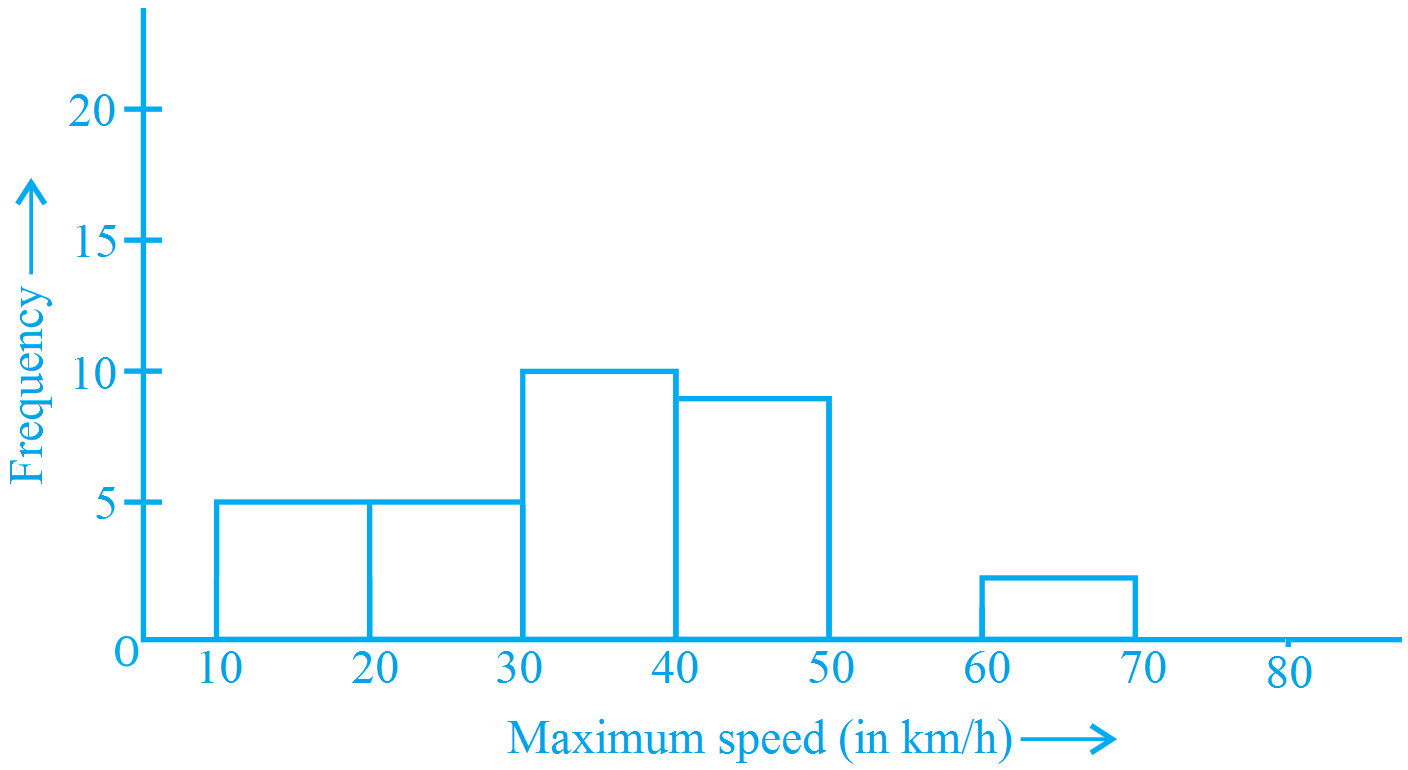
Scale:
On $X$-axis, $1$ small division $= 10\ km/h$.
On $Y$-axis, $1$ small division $= 1$ frequency. View full question & answer→Question 92 Marks
Draw a histogram to represent the frequency distribution in question $91$.
Answer
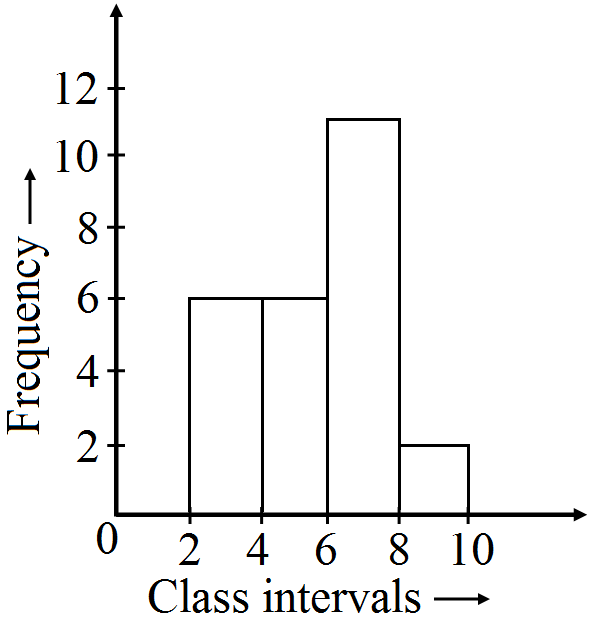
Scale:
On $X$-axis, $1$ small division = $1$ member.
On $Y$-axis, $1$ small division = $1$ family. View full question & answer→