Question 13 Marks
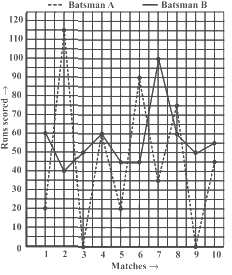
The given graph represents the total runs scored by two batsmen $A$ and $B$, during each of the ten different matches in the year $2007.$ Study the graph and answer the following question:
Among the two batsmen, who is steadier? How do you judge it?
Among the two batsmen, who is steadier? How do you judge it?
Answer
View full question & answer→From the graph, it is clear that Batsman $A$ has one great "peak" but many deep "valleys". He does not appear to be consistent. $B,$ while on the other hand, he has never scored below $A$ total of 40 runs, even though his highest score is only $100$ in comparison to $115$ of A. Also $A$ has scored $A$ zero in two matches and in $A$ total of $5$ matches he has scored less than $40$ runs. Since $A$ has $A$ lot of ups and downs, $B$ is more consistent and reliable batsman.