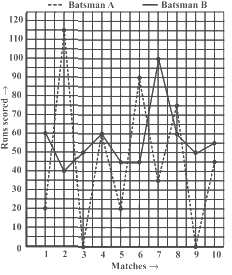
Refer, the given graph and answer the following question: How many total push-ups were done throughout the week? 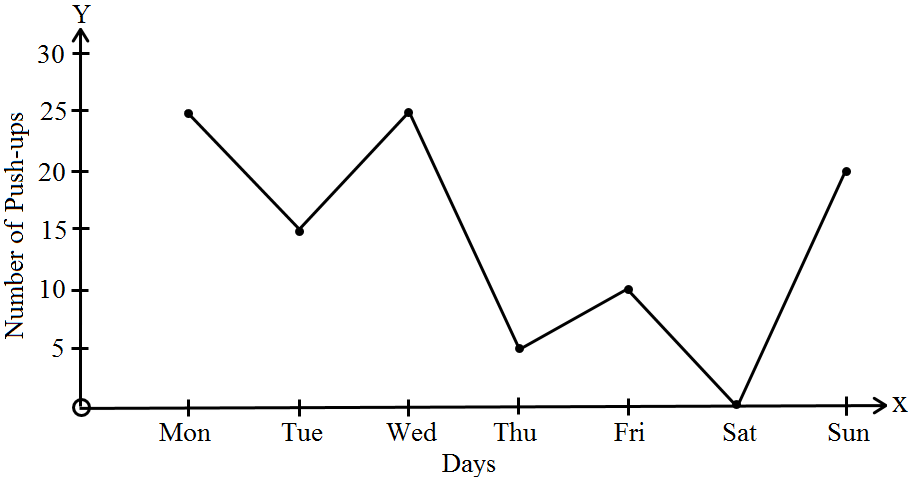
- A$90$
- B$110$
- ✓$100$
- D$105$
Answer: C.
View full solution →308 questions across 9 question groups — pick any mix to generate a MATHS paper with step-by-step answer keys.
M.C.Q. [1 Marks Each]
180 Q→02TRUE-FLASE [1 Marks Each]
1 Q→03Assertion (A) & Reason (B) MCQ
60 Q→042 Marks Questions
6 Q→053 Marks Question
1 Q→065 Marks Questions
11 Q→07Case study (4 Marks)
8 Q→081 Marks Question
26 Q→09BLANKS [1 Marks Each]
15 Q→One sample from each question group in this chapter. Select any group above to see the full set with answer keys.
Answer: C.
View full solution →
Answer: A.
View full solution →
Answer: D.
View full solution →
Answer: C.
View full solution →Answer: D.
View full solution →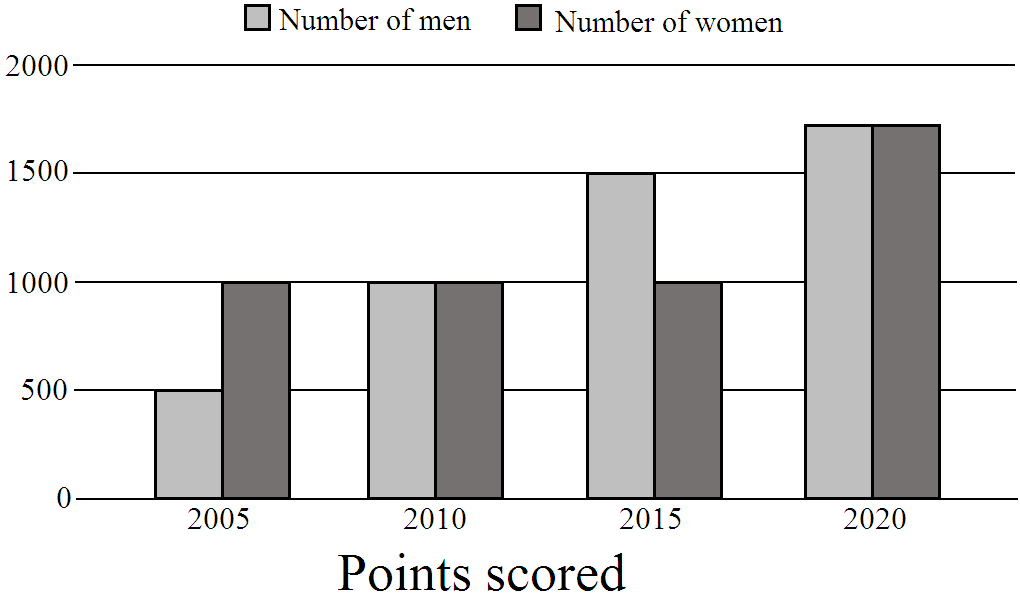

Answer: A.
View full solution →
Answer: A.
View full solution →
Answer: A.
View full solution →
Answer: D.
View full solution → Assertion (A): The coordinates of the origin are $(0, 0)$
Answer: A.
View full solution →
| Side of square $($in $cm)$ | $2$ | $3$ | $4$ | $5$ | $6$ |
| Area $($in $cm^2)$ | $4$ | $9$ | $16$ | $25$ | $36$ |
| Side of a square (in cm) | $2$ | $3$ | $3.5$ | $5$ | $6$ |
| Perimeter (in cm) | $8$ | $12$ | $14$ | $20$ | $24$ |
| Deposit $($in $₹)$ | $1000$ | $2000$ | $3000$ | $4000$ | $5000$ |
| Simple Interest $($in $₹)$ | $80$ | $160$ | $240$ | $320$ | $400$ |
| Time $($in hours$)$ | $6\ a.m.$ | $7\ a.m.$ | $8\ a.m.$ | $9\ a.m.$ |
| Distances $($in $km)$ | $40$ | $80$ | $120$ | $160$ |
| Number of apples | $1$ | $2$ | $3$ | $4$ | $5$ |
| Cost $($in $₹)$ | $5$ | $10$ | $15$ | $20$ | $25$ |

Pick question groups from the list above, set marks and difficulty, and export a branded PDF with step-by-step answer keys. First 3 chapters free — no signup.