Questions

3 Marks Question

🎯

Test yourself on this topic

3 questions · timed · auto-graded

Question 13 Marks
In a particular section of Class IX, 40 students were asked about the months of their birth and the following graph was prepared for the data so obtained:

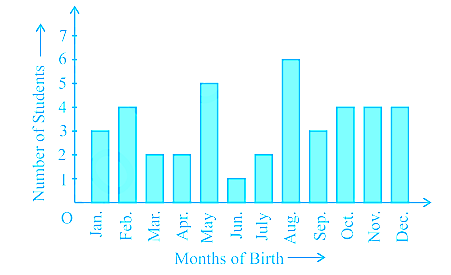
Observe the bar graph given above and answer the following questions:
  1. How many students were born in the month of November?
  2. In which month were the maximum number of students born?
Answer
from the graph it is clear that.
  1. 4 students were born in the month of November.
  2. The Maximum number of students were born in the month of August.
View full question & answer
Question 23 Marks
Consider a small unit of a factory where there are 5 employees : a supervisor and four labourers. The labourers draw a salary of ₹ 5,000 per month each while the supervisor gets ₹15,000 per month. Calculate the mean, median and mode of the salaries of this unit of the factory.
Answer
From the given data we have,

Mean = $\begin{equation} \frac{5000+5000+5000+5000+15000}{5}=\frac{35000}{5} \end{equation}$ = 7000
So, the mean salary is ₹ 7000 per month.
To obtain the median, we arrange the salaries in ascending order:
5000, 5000, 5000, 5000, 15000
Since the number of employees in the factory is 5, the median is given by the $\begin{equation} \left(\frac{5+1}{2}\right)+h=\frac{6}{2} \text { th } \end{equation}$ = 3rd observation. Therefore, the median is ₹ 5000 per month.
To find the mode of the salaries, i.e., the modal salary, we see that 5000 occurs the maximum number of times in the data 5000, 5000, 5000, 5000, 15000. So, the modal salary is ₹ 5000 per month.

View full question & answer
Question 33 Marks
Form the frequency distribution table and Find the mean of the marks obtained by $30$ students of Class $IX$ of a school, as given below:
$10, 20, 36, 92, 95, 40, 50, 56, 60, 70, 92, 88, 80, 70, 72, 70, 36, 40, 36, 40, 92, 40, 50, 50, 56, 60, 70, 60, 60, 88$
Answer
The frequency distribution table is given below.
Marks $(x_i)$ Number of students $( f_i)$ $f_ix_i$
$10$ $1$ $10$
$20$ $1$ $20$
$36$ $3$ $108$
$40$ $4$ $160$
$50$ $3$ $150$
$56$ $2$ $112$
$60$ $4$ $240$
$70$ $4$ $280$
$72$ $1$ $72$
$80$ $1$ $80$
$88$ $2$ $176$
$92$ $3$ $276$
$95$ $1$ $95$
  $\begin{equation} \sum_\limits{i=1}^{13} f_{i}=30 \end{equation}$ $\begin{equation} \sum_\limits{i=1}^{13} f_{i} x_{i}=1779 \end{equation}$
So, the mean $\begin{equation} \bar{x}=\frac{\text { Sum of all the observations }}{\text { Total number of observations }}=\left(\frac{\sum_\limits{i=1}^{13} f_{i} x_{i}}{\sum_\limits{i=1}^{13} f_{i}}\right) \end{equation}$
$\begin{equation} =\frac{1779}{30}=59.3 \end{equation}$
View full question & answer
3 Marks Question - MATHS STD 9 Questions - Vidyadip