The class mark of the class interval 2.4-6.6 is:
Question types
Statistics question types
353 questions across 7 question groups — pick any mix to generate a MATHS paper with step-by-step answer keys.
353
Questions
7
Question groups
5
Question types
01
M.C.Q
257 Q→02Assertion (A) & Reason (B) MCQ
61 Q→031 Marks Question
1 Q→042 Marks Questions
6 Q→053 Marks Question
3 Q→065 Marks Questions
14 Q→07Case study (4 Marks)
11 Q→Sample Questions
Statistics questions
One sample from each question group in this chapter. Select any group above to see the full set with answer keys.
View full solution →
The mean of the marks scored by 50 students was found to be 39. Later on it was discovered that a score of 43 was misread as 23. The correct mean is:
If the mean of five observations x, x + 2, x + 4, x + 6 and x + 8 is 11 then the value of x is:
Given the class intervals 1-10, 11-20, 21-30, …, then 20 is considered in class:
In a histogram, each class rectangle is constructed with base as:
Directions: In the following questions, the Assertions (A) and Reason(s) (R) have been put forward. Read both the statements carefully and choose the correct alternative from the following:
Assertion: If the median of the given data 26, 29, 42, 53, x, x + 2, 70, 75, 82, 93, is 65 then the value of x is 64.
Reason: When the number of observations (n) is odd the median is the value of the $\big(\frac{\text{n}+1}{2}\big)^\text{th}$ observation.
View full solution →Assertion: If the median of the given data 26, 29, 42, 53, x, x + 2, 70, 75, 82, 93, is 65 then the value of x is 64.
Reason: When the number of observations (n) is odd the median is the value of the $\big(\frac{\text{n}+1}{2}\big)^\text{th}$ observation.
- Both assertion and reason are true and reason is the correct enatixplaon of assertion.
- Both assertion and reason are true but reason is not the correct explanation of assertion.
- Assertion is true but reason is false.
- Assertion is false but reason is true.
Directions: In the following questions, the Assertions (A) and Reason(s) (R) have been put forward. Read both the statements carefully and choose the correct alternative from the following:
Assertion: The mode of above data is:
Reason: The value of variable which occur most often is mode.
Assertion: The mode of above data is:
| Class interval | 3-6 | 6-9 | 9-12 | 12-15 | 15-18 | 18-21 |
| Frequency | 2 | 5 | 21 | 23 | 10 | 12 |
- Both Assertion and reason are correct and reason is correct explanation for Assertion.
- Both Assertion and reason are correct but reason is not correct explanation for Assertion.
- Assertion is correct but reason is false.
- Both Assertions and reason are false.
Directions: In the following questions, the Assertions (A) and Reason(s) (R) have been put forward. Read both the statements carefully and choose the correct alternative from the following:
Assertion: 2, 4, 6 here median is the 4
Reason: 2, 4, 6, 8 here median is the 5
Assertion: 2, 4, 6 here median is the 4
Reason: 2, 4, 6, 8 here median is the 5
- Both Assertion and reason are correct and reason is correct explanation for Assertion.
- Both Assertion and reason are correct but reason is not correct explanation for Assertion.
- Assertion is correct but reason is false.
- Both Assertions and reason are false.
Directions: In the following questions, the Assertions (A) and Reason(s) (R) have been put forward. Read both the statements carefully and choose the correct alternative from the following:
Assertion: 13, 13, 13, 13, 14, 14, 16, 18, 21 here range is 8
Reason: 1, 2, 4, 7 here range is 6
Assertion: 13, 13, 13, 13, 14, 14, 16, 18, 21 here range is 8
Reason: 1, 2, 4, 7 here range is 6
- Both Assertion and reason are correct and reason is correct explanation for Assertion.
- Both Assertion and reason are correct but reason is not correct explanation for Assertion.
- Assertion is correct but reason is false.
- Both Assertions and reason are false.
Directions: In the following questions, the Assertions (A) and Reason(s) (R) have been put forward. Read both the statements carefully and choose the correct alternative from the following:
Assertion: Mode of given data 110, 120, 130, 120, 110, 140, 130, 120, 140, 120 is 120.
Reason: The observation with maximum frequency is called mode.
Assertion: Mode of given data 110, 120, 130, 120, 110, 140, 130, 120, 140, 120 is 120.
Reason: The observation with maximum frequency is called mode.
- Both Assertion and reason are correct and reason is correct explanation for Assertion.
- Both Assertion and reason are correct but reason is not correct explanation for Assertion.
- Assertion is correct but reason is false.
- Both Assertions and reason are false.
Find the mode of the following marks (out of 10) obtained by 20 students. 4, 6, 5, 9, 3, 2, 7, 7, 6, 5, 4, 9, 10, 10, 3, 4, 7, 6, 9, 9
Let us now consider the following frequency distribution table which gives the weights of 38 students of a class:
| Weights (in kg) | Number of students |
| 31-35 | 9 |
| 36-40 | 5 |
| 41-45 | 14 |
| 46-50 | 3 |
| 51-55 | 1 |
| 56-60 | 2 |
| 61-65 | 2 |
| 66-70 | 1 |
| 71-75 | 1 |
| Total | 38 |
Now, if two new students of weights 35.5 kg and 40.5 kg are admitted in this class, then in which interval will we include them. Create a frequency distribution table for this class interval.
100 plants each were planted in 100 schools during Van Mahotsava. After one month, the number of plants that survived were recorded as : 95, 67, 28, 32, 65, 65, 69, 33, 98, 96, 76, 42, 32, 38, 42, 40, 40, 69, 95, 92, 75, 83, 76, 83, 85, 62, 37, 65, 63, 42, 89, 65, 73, 81, 49, 52, 64, 76, 83, 92, 93, 68, 52, 79, 81, 83, 59, 82, 75, 82, 86, 90, 44, 62, 31, 36, 38, 42, 39, 83, 87, 56, 58, 23, 35, 76, 83, 85, 30, 68, 69, 83, 86, 43, 45, 39, 83, 75, 66, 83, 92, 75, 89, 66, 91, 27, 88, 89, 93, 42, 53, 69, 90, 55, 66, 49, 52, 83, 34, 36
Create a frequency distribution table with tally number.
Create a frequency distribution table with tally number.
Consider the marks obtained (out of 100 marks) by 30 students of Class IX of a school and create a frequency distribution table: 10, 20, 36, 92, 95, 40, 50, 56, 60, 70, 92, 88, 80, 70, 72, 70, 36, 40, 36, 40, 92, 40, 50, 50, 56, 60, 70, 60, 60, 88
The points scored by a Kabaddi team in a series of matches are as follows:
17, 2, 7, 27, 15, 5, 14, 8, 10, 24, 48, 10, 8, 7, 18, 28
Find the median of the points scored by the team.
17, 2, 7, 27, 15, 5, 14, 8, 10, 24, 48, 10, 8, 7, 18, 28
Find the median of the points scored by the team.
The heights (in cm) of 9 students of a class are as follows:
155, 160, 145, 149, 150, 147, 152, 144, 148
Find the median of this data.
155, 160, 145, 149, 150, 147, 152, 144, 148
Find the median of this data.
In a particular section of Class IX, 40 students were asked about the months of their birth and the following graph was prepared for the data so obtained:
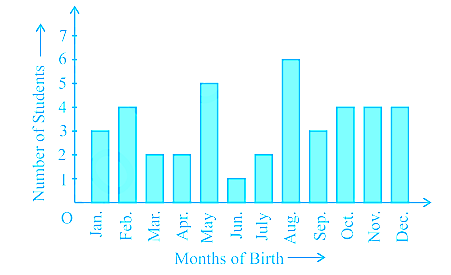
Observe the bar graph given above and answer the following questions:
Observe the bar graph given above and answer the following questions:
- How many students were born in the month of November?
- In which month were the maximum number of students born?
Consider a small unit of a factory where there are 5 employees : a supervisor and four labourers. The labourers draw a salary of ₹ 5,000 per month each while the supervisor gets ₹15,000 per month. Calculate the mean, median and mode of the salaries of this unit of the factory.
Form the frequency distribution table and Find the mean of the marks obtained by $30$ students of Class $IX$ of a school, as given below:
$10, 20, 36, 92, 95, 40, 50, 56, 60, 70, 92, 88, 80, 70, 72, 70, 36, 40, 36, 40, 92, 40, 50, 50, 56, 60, 70, 60, 60, 88$
View full solution →$10, 20, 36, 92, 95, 40, 50, 56, 60, 70, 92, 88, 80, 70, 72, 70, 36, 40, 36, 40, 92, 40, 50, 50, 56, 60, 70, 60, 60, 88$
100 surnames were randomly picked up from a local telephone directory and a frequency distribution of the number of letters in the English alphabets in the surnames was found as follows :
| Number of letters | Number of surnames |
|---|---|
| 1-4 | 6 |
| 4-6 | 30 |
| 6-8 | 44 |
| 8-12 | 16 |
| 12-20 | 4 |
- Draw a histogram to depict the given information.
- Write the class interval in which the maximum number of surnames lie.
A random survey of the number of children of various age groups playing in a park was found as follows
| Age (in years) | Number of children |
| 1-2 | 5 |
| 2-3 | 3 |
| 3-5 | 6 |
| 5-7 | 12 |
| 7-10 | 9 |
| 10-15 | 10 |
| 15-17 | 4 |
Draw a histogram to represent the data above.
The runs scored by two teams A and B on the first 60 balls in a cricket match are given below :
| Number of balls | Team A | Team B |
|---|---|---|
| 1-6 | 2 | 5 |
| 7-12 | 1 | 6 |
| 13-18 | 8 | 2 |
| 19-24 | 9 | 10 |
| 25-30 | 4 | 5 |
| 31-36 | 5 | 6 |
| 37-42 | 6 | 3 |
| 43-48 | 10 | 4 |
| 49-54 | 6 | 8 |
| 55-60 | 2 | 10 |
Represent the data of both the teams on the same graph by frequency polygons.
[Hint: First make the class intervals continuous.]
The following table gives the distribution of students of two sections according to the marks obtained by them:
| Section A | Section B | ||
|---|---|---|---|
| Marks | Frequency | Marks | Frequency |
| 0-10 | 3 | 0-10 | 5 |
| 10-20 | 9 | 10-20 | 19 |
| 20-30 | 17 | 20-30 | 15 |
| 30-40 | 12 | 30-40 | 10 |
| 40-50 | 9 | 40-50 | 1 |
Represent the marks of the students of both the sections on the same graph by frequency polygons.
The following table gives the life times of 400 neon lamps :
| Life time(in hours) | Number of lamps |
|---|---|
| 300-400 | 14 |
| 400-500 | 56 |
| 500-600 | 60 |
| 600-700 | 86 |
| 700-800 | 74 |
| 800-900 | 62 |
| 900-1000 | 48 |
- Represent the given information with the help of a histogram.
- How many lamps have a life time of more than 700 hours?
Read the Source/ Text given below and answer answer these questions:
A healthcare survey was done by the state health and family welfare care board of the state of Punjab. The data is collected by forming age groups; i.e; 10-15, 20-25 .... and so on. The overall data from a town is given below in the form of a bar graph. Read the data carefully and answer the questions that follow.
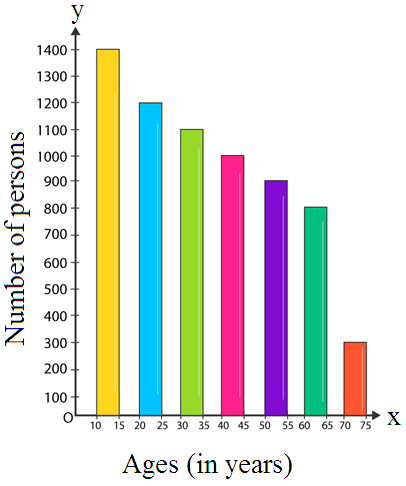
A healthcare survey was done by the state health and family welfare care board of the state of Punjab. The data is collected by forming age groups; i.e; 10-15, 20-25 .... and so on. The overall data from a town is given below in the form of a bar graph. Read the data carefully and answer the questions that follow.
- What is the percentage of the youngest age-group persons over those in the oldest age group?
- 400.56%
- 466.67%
- 500%
- 500.67%
- What is the total population of the town?
- 6800
- 7000
- 6700
- 6600
- How many persons are more in the age-group 10-15 than in the age group 30-35?
- 100
- 200
- 250
- 300
- What is the age-group of exactly 1200 persons living in the town?
- 20-25
- 10-15
- 15-20
- 25-30
- What is the total number of persons living in the town in the age-groups 10-15 and 60-65?
- 2100
- 2000
- 2200
- 2400
Read the Source/ Text given below and answer these questions:
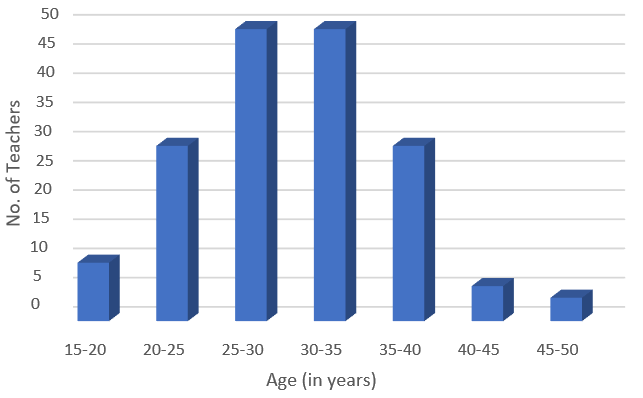
A teacher is a person whose professional activity involves planning, organizing, and conducting group activities to develop students’ knowledge, skills, and attitudes as stipulated by educational programs. Teachers may work with students as a whole class, in small groups or one-to-one, inside or outside regular classrooms. In this indicator, teachers are compared by their average age and work experience measured in years.
For the same in 2015, the following distribution of ages (in years) of primary school teachers in a district was collected to evaluate the teacher on the above-mentioned criterion.
- Write the lower limit of the first-class interval:
- 15
- 20
- 17.5
- 5
- Determine the class limits of the fourth class interval:
- 25-30
- 30-35
- 40-45
- 45-50
- Find the class mark of class 45-50:
- 45.5
- 47.5
- 54.5
- 55.5
- Determine the class size:
- 4
- 5.5
- 5
- 6
- Facts or figures collected with a definite purpose are called _____.
- Data.
- Sample.
- Information.
- Statistics.
Read the Source/ Text given below and answer any four questions:
A recent survey by a labour organization of the state government of Odisha found that the wages of workers in a factory for different age groups are distributed as given in the bar graph. Read the bar graph carefully and answer the questions that follow.
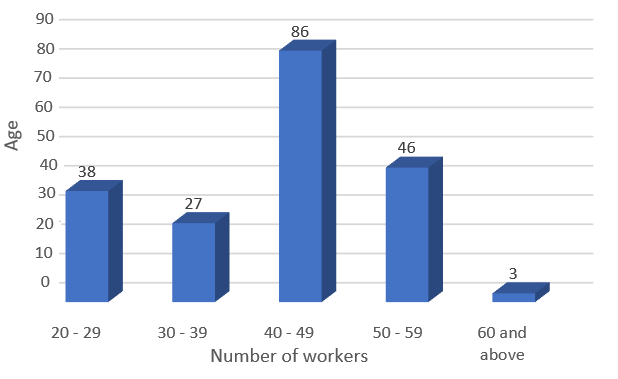

If a person is selected at random, find the probability that the person is.
A recent survey by a labour organization of the state government of Odisha found that the wages of workers in a factory for different age groups are distributed as given in the bar graph. Read the bar graph carefully and answer the questions that follow.
If a person is selected at random, find the probability that the person is.
- 40 years or more:
- 0.675
- 0.576
- 0.86
- 0.10
- Under 40 years:
- 0
- 0.325
- 0.531
- 0.27
- Having age from 30 to 39 years:
- 0.553
- 0.513
- 0.135
- 0.125
- Under 60 but above 39 years:
- 0.62
- 0.66
- 0.55
- 0.02
- Not less than 20 years:
- 0
- 1.03
- 0.01
- 1
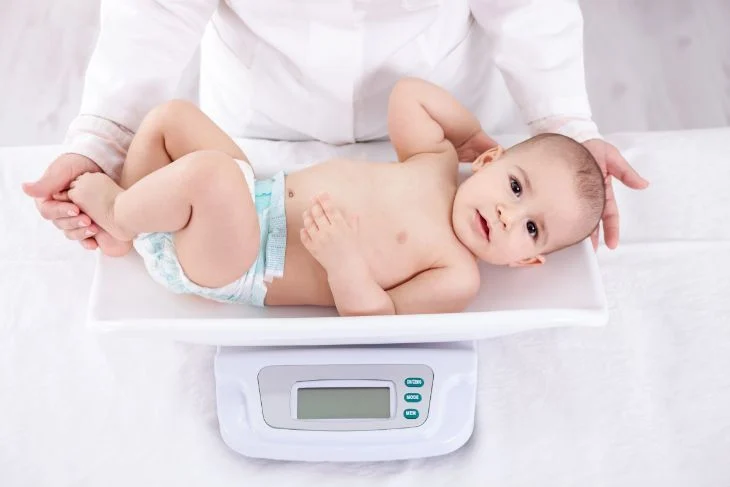
Read the Source/ Text given below and answer any four questions:
The weights of newborn babies (in kg.) are recorded to maintain the health report cards in Apollo hospital on regular basis. On a particular day the weights of newborn recorded are are as follows:
3.1, 3.0, 2.9, 2.9, 2.8, 2.8, 2.7, 2.7, 2.6, 2.5, 2.5, 2.4, 2.3, 2.2, 2.1.
The weights of newborn babies (in kg.) are recorded to maintain the health report cards in Apollo hospital on regular basis. On a particular day the weights of newborn recorded are are as follows:
3.1, 3.0, 2.9, 2.9, 2.8, 2.8, 2.7, 2.7, 2.6, 2.5, 2.5, 2.4, 2.3, 2.2, 2.1.
- Determine the range:
- 1.0Kg
- 2.1Kg
- 2.7Kg
- 2.0kg
- How many babies were born on that day?
- 11
- 15
- 12
- 16
- How many babies weight below 2.5kg?
- 3
- 4
- 5
- 6
- How many babies weigh more than 2.8kg?
- 1
- 2
- 3
- 4
- How many babies weight 2.8kg?
- 1
- 2
- 3
- 4
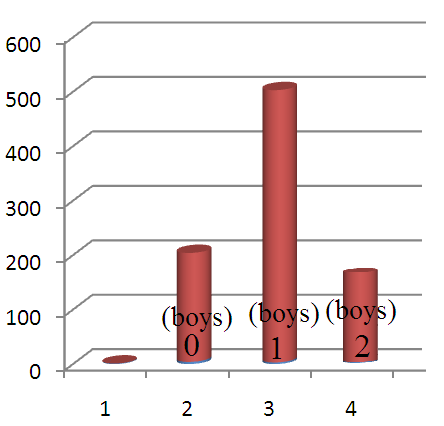
Read the Source/ Text given below and answer these questions:
In a healthcare survey by the state government of Maharashtra to study the malnutritional problems in children, 1000 families with 2 children were selected randomly from a town and the following data were recorded:

If a family is chosen at random.
View full solution →In a healthcare survey by the state government of Maharashtra to study the malnutritional problems in children, 1000 families with 2 children were selected randomly from a town and the following data were recorded:
If a family is chosen at random.
- The probability that is no boy:
- $-\frac{6}{25}$
- $\frac{6}{25}$
- $0$
- $\frac{3}{5}$
- The probability that it has one boy:
- $\frac{14}{25}$
- $\frac{16}{25}$
- $1$
- $\frac{6}{25}$
- The probability that it has 2 boys:
- $\frac35$
- $\frac45$
- $\frac15$
- $\frac{3}{5}$
- The probability that it has at least one boy:
- $\frac{16}{25}$
- $\frac{14}{25}$
- $\frac{6}{25}$
- $\frac{19}{25}$
- The probability that it has at most 1 boy:
- $\frac45$
- $\frac65$
- $\frac15$
- $\frac15$
Generate a Statistics paper free
Pick question groups from the list above, set marks and difficulty, and export a branded PDF with step-by-step answer keys. First 3 chapters free — no signup.