Question 14 Marks
Read the Source/ Text given below and answer answer these questions:
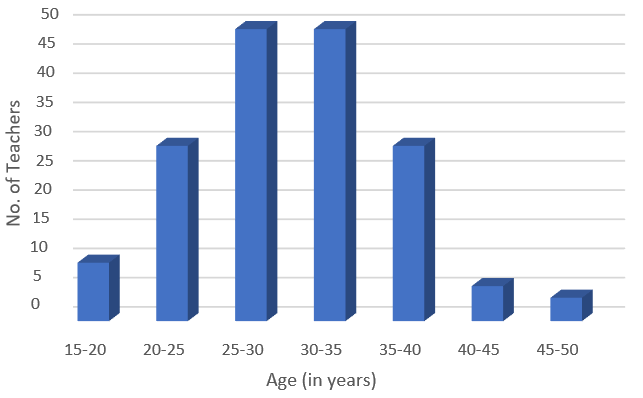
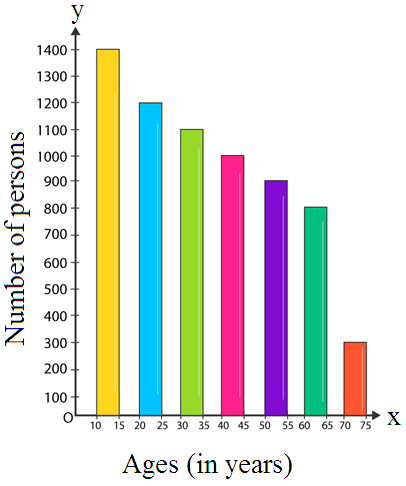
A healthcare survey was done by the state health and family welfare care board of the state of Punjab. The data is collected by forming age groups; i.e; 10-15, 20-25 .... and so on. The overall data from a town is given below in the form of a bar graph. Read the data carefully and answer the questions that follow.
A healthcare survey was done by the state health and family welfare care board of the state of Punjab. The data is collected by forming age groups; i.e; 10-15, 20-25 .... and so on. The overall data from a town is given below in the form of a bar graph. Read the data carefully and answer the questions that follow.
- What is the percentage of the youngest age-group persons over those in the oldest age group?
- 400.56%
- 466.67%
- 500%
- 500.67%
- What is the total population of the town?
- 6800
- 7000
- 6700
- 6600
- How many persons are more in the age-group 10-15 than in the age group 30-35?
- 100
- 200
- 250
- 300
- What is the age-group of exactly 1200 persons living in the town?
- 20-25
- 10-15
- 15-20
- 25-30
- What is the total number of persons living in the town in the age-groups 10-15 and 60-65?
- 2100
- 2000
- 2200
- 2400
Answer
View full question & answer→|
(i)
|
(b)
|
446.67%
|
|
(ii)
|
(c)
|
6700
|
|
(iii)
|
(d)
|
300
|
|
(iv)
|
(a)
|
20-25
|
|
(v)
|
(c)
|
2200
|