Question 1011 Mark
Write the correct answer in the following:
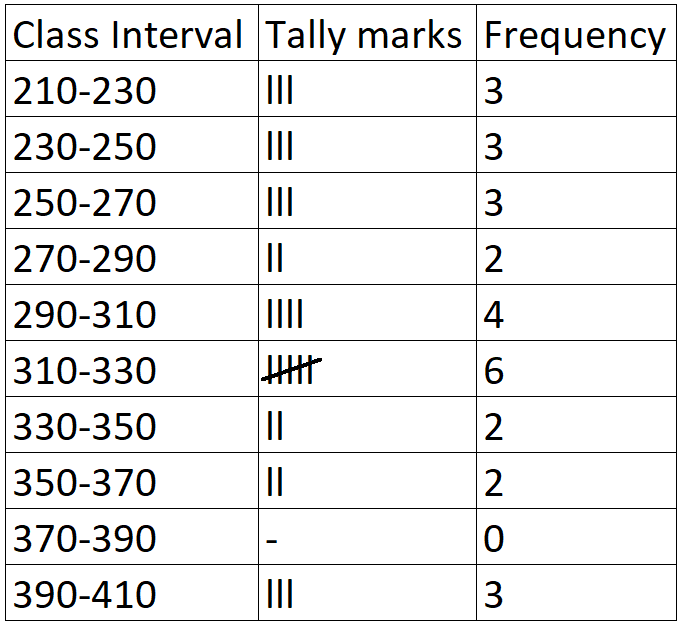
A grouped frequency table with class intervals of equal sizes using 250-270 (270 not included in this interval) as one of the class interval is constructed for the following data:
268, 220, 368, 258, 242, 310, 272, 342, 310, 290, 300, 320, 319, 304, 402, 318, 406, 292, 354, 278, 210, 240, 330, 316, 406, 215, 258, 236.
The frequency of the class 310-330 is:
Answer
The observation corresponding to class 310–330 (330 not included in this interval) are 310, 310, 320, 319, 318, 316, i.e., 6 observations.
View full question & answer→- 6
The observation corresponding to class 310–330 (330 not included in this interval) are 310, 310, 320, 319, 318, 316, i.e., 6 observations.