Question types

Data Handling – III (Pictorial Representation of Data as Pie Charts) question types

24 questions across 2 question groups — pick any mix to generate a MATHS paper with step-by-step answer keys.

24
Questions
2
Question groups
5
Question types
Sample Questions

Data Handling – III (Pictorial Representation of Data as Pie Charts) questions

One sample from each question group in this chapter. Select any group above to see the full set with answer keys.

The following pie$-$chart shows the monthly expenditure of Shikha on various items. If she spends $₹ 16000$ per month, answer the following questions:

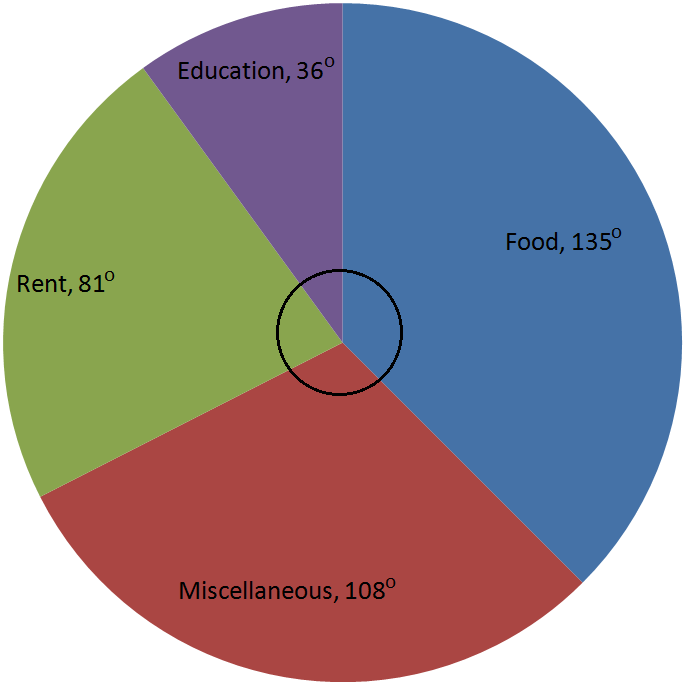
$i.$ How much does she spend on rent?
$ii.$ How much does she spend on education?
$iii.$ What is the ratio of expenses on food and rent?
View full solution
The following pie$-$chart shows the number of students admitted in different faculties of a college. If $1000$ students are admitted in Science answer the following:

$i.$ What is the total number of students$?$
$ii.$ What is the ratio of students in science and arts$?$
View full solution
In the pie-chart shows the marks obtained by a student in various subjects. If the student scored $135$ marks in mathematics, find the total marks in all the subjects. Also, find his score in individual subjects.
View full solution
In the pie-chart shows the marks obtained by a student in an examination. If the student secures $440$ marks in all, calculate his marks in each of the given subjects.
View full solution
The pie-chart given in represents the expenditure on different items in constructing a flat in Delhi. If the expenditure incurred on cement is $₹\ 112500,$ find the following:

$i.$ Total cost of the flat.
$ii.$ Expenditure incurred on labour.
View full solution
The pie-chart given in shows the annual agricultural production of an Indian state. If the total production of all the commodities is $81000$ tonnes, find the production $($in tonnes$)$ of:
$i.$ Wheat
$ii.$ Sugar
$iii.$ Rice
$iv.$ Maize
$v.$ Gram
View full solution
The percentages of various categories of workers in a state are given in the following table.
Catrgoies
Culti-vators
Agricultural Labourers
Industrial Workers
Commercial Workers
Others
% of workers
$40$
$25$
$12.5$
$10$
$12.5$
Present the information in the form a pie-chart.
View full solution
The number of hours, spent by a school boy on different activities in a working day, is given below:
Activities
Sleep
School
Home
Play
Others
Total
Number of hours
$8$
$7$
$4$
$2$
$3$
$24$
Present the information in the form of a pie-chart.
View full solution
Employees of a company have been categorized according to their religions as given below:
Religions
Hindu
Muslim
Sikh
Christian
Total
Number of Workers
$420$
$300$
$225$
$105$
$1080$
Draw a pie-chart to represent the above information.
View full solution
Represent the following data by a pie-diagram:
Items of expenditure
Expenditure
Family $A$
Family $B$
Food
$4000$
$6400$
Clothing
$2500$
$480$
Rent
$1500$
$3200$
Education
$400$
$1000$
Miscellaneous
$1600$
$600$
Total
$10000$
$16000$
View full solution

Generate a Data Handling – III (Pictorial Representation of Data as Pie Charts) paper free

Pick question groups from the list above, set marks and difficulty, and export a branded PDF with step-by-step answer keys. First 3 chapters free — no signup.

Download App