Question 13 Marks
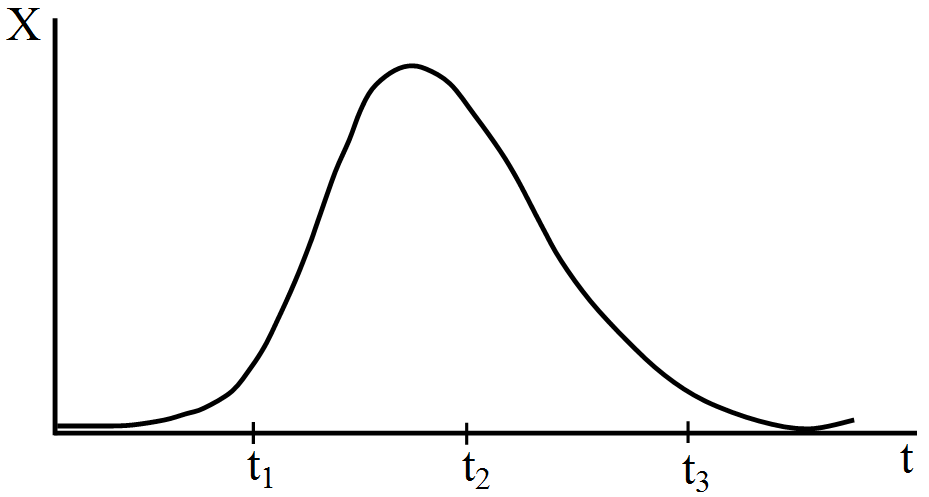
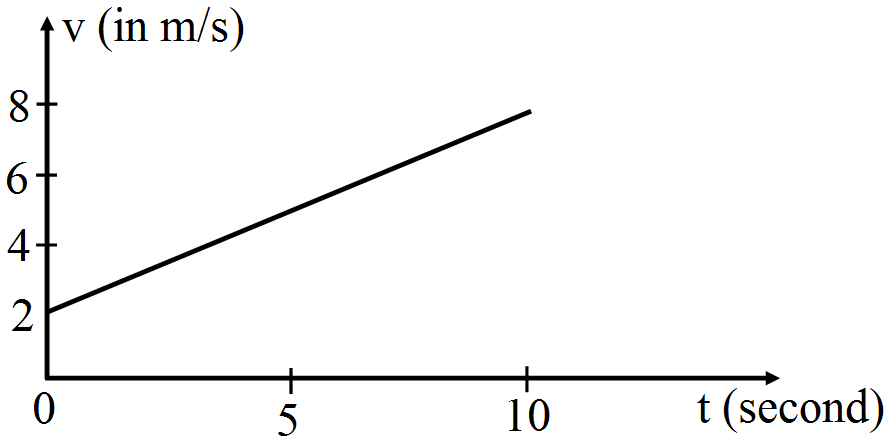
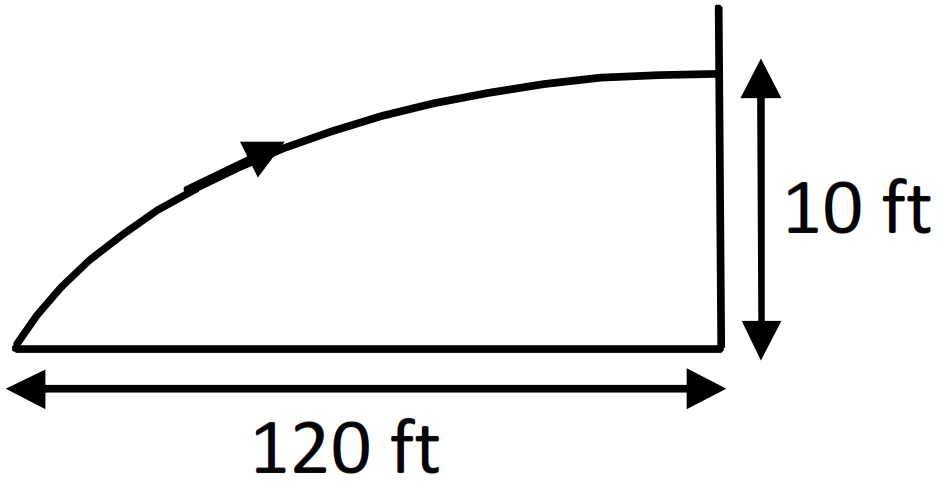
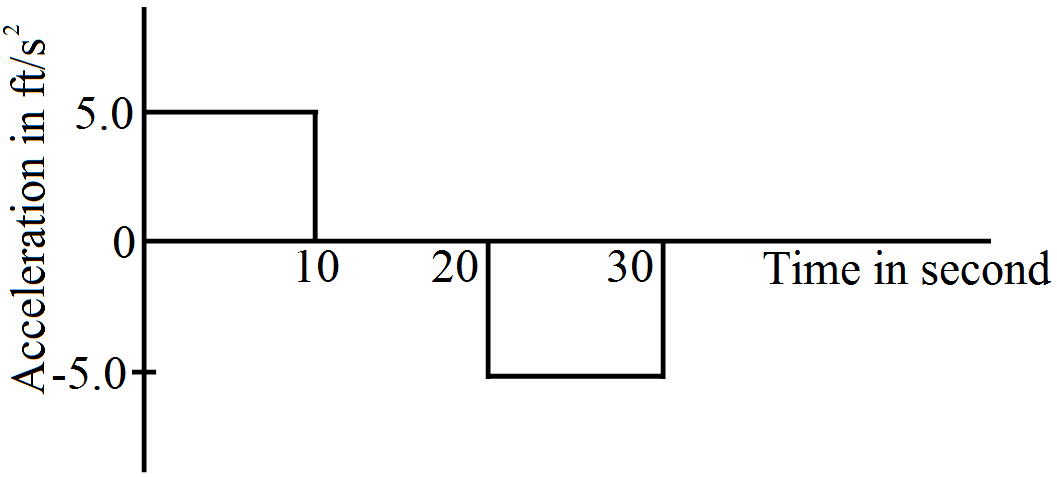
The acceleration of a cart started at $t = 0$, varies with time as shown in figure. Find the distance travelled in $30$ seconds and draw the position-time graph.
Answer
View full question & answer→In $1^{\text {st }}$ seconds, $\mathrm{S}_1=$ ut $+\frac{1}{2}$ at $^2=0+\frac{1}{2} \times 5 \times 10^2=250 \mathrm{ft}$.
At $\mathrm{t}=10 \mathrm{~s}, \mathrm{v}=\mathrm{u}+\mathrm{at}=0+5 \times 10=50 \mathrm{ft} / \mathrm{s} .$
$ \therefore$ From 10 to 20 seconds $(\Delta \mathrm{t}=20-10=10 \mathrm{sec}) \mathrm{moves}$ with uniform velocity $50 \mathrm{ft} / \mathrm{sec}$,
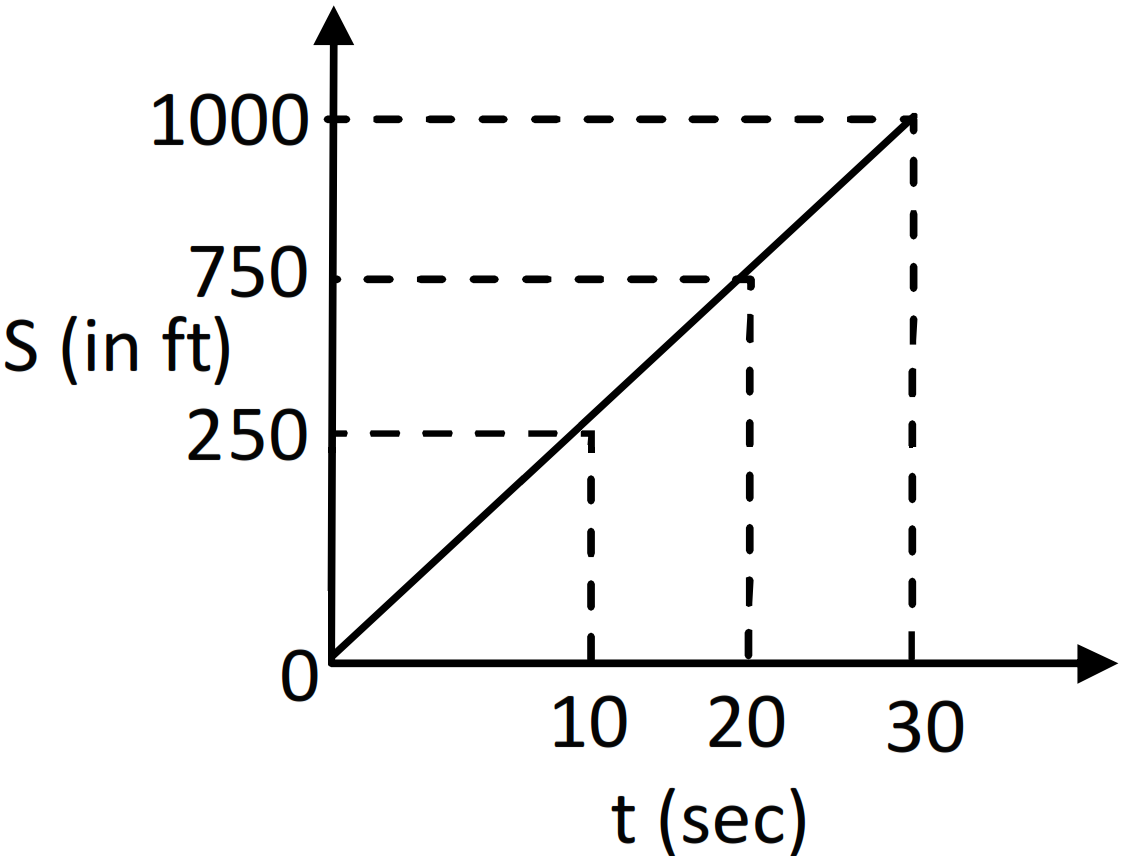
Distance $\mathrm{S}_2=50 \times 10=500 \mathrm{ft}$ Between 20 sec to 30 sec acceleration is constant i.e. $-5 \mathrm{ft} / \mathrm{s}^2$. At 20 sec velocity is $50 \mathrm{ft} / \mathrm{sec} . \mathrm{t}=30-20=10 \mathrm{~s} \mathrm{~S}_3=\mathrm{ut}+\frac{1}{2} \mathrm{at}^2=50 \times 10+\frac{1}{2}(-5) 10^2$
$\mathrm{S}_3=500-250=250 \mathrm{ft}$
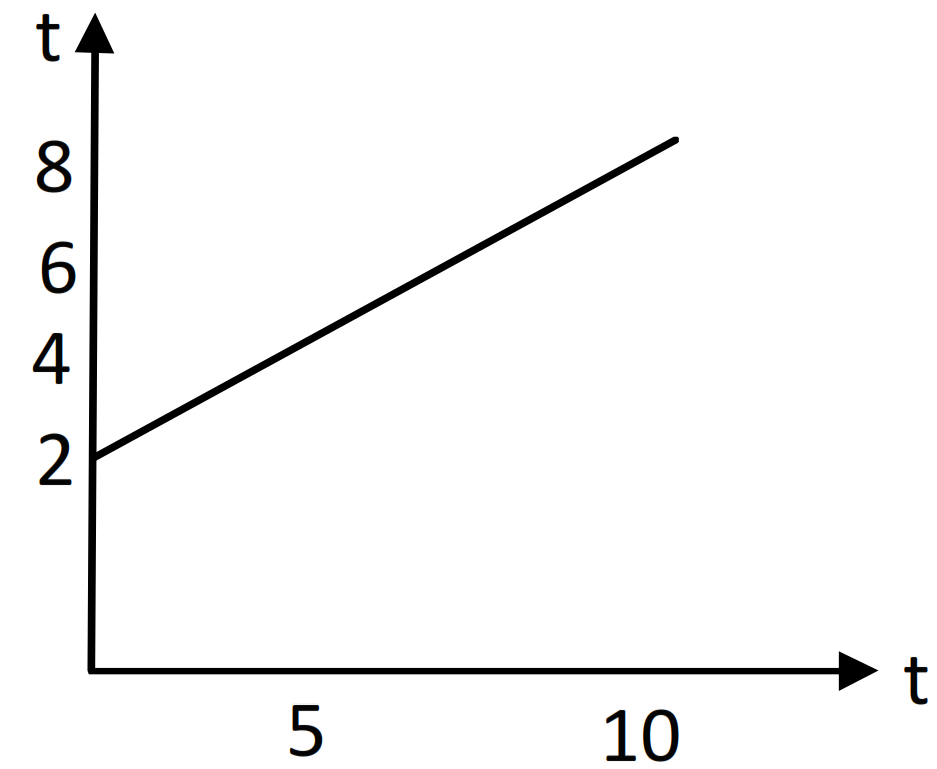
Total distance travelled is $30 \mathrm{~s}: S_1+S_2+S_3=250+500+250=1000 \mathrm{ft}$ The position-time graph:
At $\mathrm{t}=10 \mathrm{~s}, \mathrm{v}=\mathrm{u}+\mathrm{at}=0+5 \times 10=50 \mathrm{ft} / \mathrm{s} .$
$ \therefore$ From 10 to 20 seconds $(\Delta \mathrm{t}=20-10=10 \mathrm{sec}) \mathrm{moves}$ with uniform velocity $50 \mathrm{ft} / \mathrm{sec}$,
Distance $\mathrm{S}_2=50 \times 10=500 \mathrm{ft}$ Between 20 sec to 30 sec acceleration is constant i.e. $-5 \mathrm{ft} / \mathrm{s}^2$. At 20 sec velocity is $50 \mathrm{ft} / \mathrm{sec} . \mathrm{t}=30-20=10 \mathrm{~s} \mathrm{~S}_3=\mathrm{ut}+\frac{1}{2} \mathrm{at}^2=50 \times 10+\frac{1}{2}(-5) 10^2$
$\mathrm{S}_3=500-250=250 \mathrm{ft}$
Total distance travelled is $30 \mathrm{~s}: S_1+S_2+S_3=250+500+250=1000 \mathrm{ft}$ The position-time graph: