Question
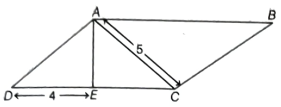
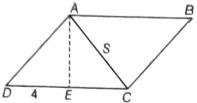
$A B C D$ is a parallelogram in which $A E \perp C D$ as shown in figure, also $A C=A D$ and $A C=5 cm, D E=4 cm$ and area of $\triangle A E D=6 cm^2$. Then, find
(i) area of $\triangle A D C$
(ii) area of parallelograr $A B C D$.
(iii) Perimeter of parallelogram $A B C D$
Image

Need a full question paper?

Generate a complete, print-ready paper with questions like this in minutes — across 16+ boards, with answer keys.

Start Generating Free

Similar questions

Find the value of p, if the mean of the following distribution is $20$
x:
$15$
$17$
$19$
$20 + p$
$23$
f:
$2$
$3$
$4$
$5 p$
$6$
Rintu takes care of a date-palm tree farm in Habra. The heights of the trees (in feet) in his farm are given as: 50, 45, 43, 52, 61, 63, 46, 55, 60, 55, 59, 56, 56, 49, 54, 65, 66, 51, 44, 58, 60, 54, 52, 57, 61, 62, 60, 60, 67. Fill the dot plot, and mark the mean and median. How would you describe the heights of these palm trees? Can you think of quicker ways to find the mean? How many trees are shorter than the average height?
Image
Read the bar graph (in the given figure), which shows the number of books sold by a bookstore during five consecutive years and answer the following questions :
Image
(i) About how many books were sold in 1989, 1990 and 1992?
(ii) In which year were about 475 books sold? About 225 books sold?
(iii) In which years were fewer than 250 books sold?
(iv) Can you explain how you would estimate the number of books sold in 1989?
The label on a bottle of pet vitamins lists dosage guidelines. What dosage would you give to each of these animals?
$a.$ A $18\ kg$ adult dog.
$b.$ A $6\ kg$ cat.
$c.$ A $18\ kg$ pregnant dog.
The following table shows the interest paid by India (in thousand crore rupees) on external debts during the period $1998-99$ to $2002-03.$ Represent the data by a bar graph.
Year
$1998-99$
$1999-2000$
$2000-01$
$2001-02$
$2002-03$
Interest (in thousand crore rupees)
$70$
$84$
$98$
$106$
$120$
Select those rational numbers which can be written as a rational number with numerator 6: $\frac{1}{22}, \frac{2}{3}, \frac{3}{4}, \frac{4}{-5}, \frac{5}{6}, \frac{-6}{7}, \frac{-7}{8}$
The following table gives the route length (in thousand kilometres) of the Indian Railways in some of the years:
Year1960-611970-711980-811990-912000-2001
Route length (in thousand kilometres)5660617498
Represent the above data with the help of a bar graph.
Find the missing values.
S.No.BaseHeightArea of the triangle
(i)15 cm...$87 cm^2$
(ii)...31.4 mm$1256 cm^2$
(iii)22 cm...$170.5 cm^2$
Construct a $\triangle\text{ABC}$ in which $BC = 5.8\ cm$,$\angle\text{B}=\angle\text{C}=30^\circ.$ Measure $AB$ and $AC$. What do you observe?
The marks out of $100$ obtained by Kunal and Soni in the half yearly examination are given below:
Subjects English Hindi Maths Science S.Science Sanskrit
Kunal $72$ $81$ $92$ $96$ $64$ $85$
Soni $86$ $89$ $90$ $82$ $75$ $82$
$a.$ Draw a double bar graph by choosing appropriate scale.
$b.$ Calculate the total percentage of marks obtained by Soni.
$c.$ Calculate the total percentage of marks obtained by Kunal.
$d.$ Compare the percentages of marks obtained by Kunal and Soni.
$e.$ In how many subjects did Soni get more marks than Kunal? Which are those subjects?
$f.$ Who got more marks in $S.$ Science and what was the difference of marks?
$g.$ In which subject the difference of marks was maximum and by how much?