A mass $m$ attached to free end of a spring executes SHM with a period of $1\; s$. If the mass is increased by $3\; kg$ the period of oscillation increases by one second, the value of mass $m$ is $..............kg$.
JEE MAIN 2023, Medium
Download our app for free and get started
$T =2 \pi \sqrt{\frac{ m }{ k }}=1$
$T ^{\prime}=2 \pi \sqrt{\frac{ m +3}{ k }}=2$
$\frac{ T }{ T ^{\prime}}=\sqrt{\frac{ m }{ m +3}}=\frac{1}{2}$
$\Rightarrow \frac{ m }{ m +3}=\frac{1}{4}$
$m =1$

Download our appand get started for free
Experience the future of education. Simply download our apps or reach out to us for more information. Let's shape the future of learning together!No signup needed.*
Similar Questions
- 1A body oscillates with a simple harmonic motion having amplitude $0.05\, m .$ At a certain instant, its displacement is $0.01\, m$ and acceleration is $1.0 \,m / s ^{2} .$ The period of oscillation isView Solution
- 2A particle executes $S.H.M.$ with a period of $6$ second and amplitude of $3\, cm$. Its maximum speed in $cm/sec$ isView Solution
- 3The oscillation of a body on a smooth horizontal surface is represented by the equation $x= Acos$$\omega t$View Solution
where $x=$ displacement at time $t$
$\omega =$ frequency of oscillation
Which one of the following graphs shows correctly the variation $a$ with $t$ ?
Here $a=$ acceleration at time $t$
$T=$ time period
- 4A particle moves in $xy$ plane according to the law $x = a \sin \omega t$ and $y = a(1-\cos \omega t)$ where $a$ and $\omega$ are constants. The particle tracesView Solution
- 5The amplitude of a particle executing $SHM$ is $3\,cm$. The displacement at which its kinetic energy will be $25 \%$ more than the potential energy is: $.............cm$.View Solution
- 6View SolutionResonance is an example of
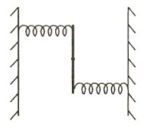
- 7A uniform rod of length $L$ and mass $M$ is pivoted at the centre. Its two ends are attached to two springs of equal spring constants $k$. The springs are fixed to rigid supports as shown in the figure, and the rod is free to oscillate in the horizontal plane. The rod is gently pushed through a small angle $\theta$ in one direction and released. The frequency of oscillation isView Solution
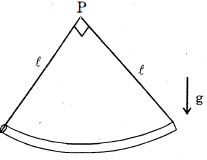
- 8A circular arc of mass $m$ is connected with the help of two massless strings as shown in the figuw in vertical plane. About point $P$, small oscillations are given in the plane of the arc. Time period of the oscillations of $SHM$ will beView Solution
- 9There is a simple pendulum hanging from the ceiling of a lift. When the lift is stand still, the time period of the pendulum is $T$. If the resultant acceleration becomes $g/4,$ then the new time period of the pendulum isView Solution
- 10A particle executes $SHM$ of period $1.2\, sec$ and amplitude $8\, cm.$ Find the time it takes to travel $3\,cm$ from the positive extremity of its oscillation. ..... $\sec$View Solution