A particle performs $SHM$ about $x = 0$ such that at $t = 0$ it is at $x = 0$ and moving towards positive extreme. The time taken by it to go from $x = 0$ to $x = \frac{A}{2}$ is ..... times the time taken to go from $x = \frac{A}{2}$ to $A$. The most suitable option for the blank space is
Diffcult
Download our app for free and get started
Time for $x=0$ to $x=\frac{A}{2}$ is
$\frac{\mathrm{A}}{2}=\mathrm{A} \sin \omega \mathrm{t}_{1} \quad \Rightarrow \omega \mathrm{t}_{1}=\frac{\pi}{6} \Rightarrow \mathrm{t}_{1}=\frac{\pi}{6 \omega}$
$\Rightarrow t_{1}=\frac{T}{12}$
and from $x=\frac{A}{2}$ to $x=A$ is
$\mathrm{t}_{2}=\frac{\mathrm{T}}{4}-\frac{\mathrm{T}}{12}=\frac{\mathrm{T}}{6} \Rightarrow \frac{\mathrm{t}_{1}}{\mathrm{t}_{2}}=\frac{1}{2}$

Download our appand get started for free
Experience the future of education. Simply download our apps or reach out to us for more information. Let's shape the future of learning together!No signup needed.*
Similar Questions
- 1A sphere of radius $r$ is kept on a concave mirror of radius of curvature $R$. The arrangement is kept on a horizontal table (the surface of concave mirror is frictionless and sliding not rolling). If the sphere is displaced from its equilibrium position and left, then it executes $S.H.M.$ The period of oscillation will beView Solution
- 2A particle executes $SHM.$ Its velocities are $v_1$and $v_2$ at displacement $x_1$ and $x_2$ from mean position respectively. The frequency of oscillation will beView Solution
- 3The oscillation of a body on a smooth horizontal surface is represented by the equation $x= Acos$$\omega t$View Solution
where $x=$ displacement at time $t$
$\omega =$ frequency of oscillation
Which one of the following graphs shows correctly the variation $a$ with $t$ ?
Here $a=$ acceleration at time $t$
$T=$ time period
- 4A mass $m$ attached to free end of a spring executes SHM with a period of $1\; s$. If the mass is increased by $3\; kg$ the period of oscillation increases by one second, the value of mass $m$ is $..............kg$.View Solution
- 5View SolutionIdentify the correct definition
- 6The displacement of a particle executing periodic motion is given by :View Solution
$y = 4cos^2\,(t/2)sin\,(1000t)$
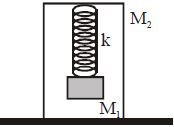
This expression may be considered to be a result of superposition of - 7$A$ block of mass $M_1$ is hanged by a light spring of force constant $k$ to the top bar of a reverse Uframe of mass $M_2$ on the floor. The block is pooled down from its equilibrium position by $a$ distance $x$ and then released. Find the minimum value of $x$ such that the reverse $U$ -frame will leave the floor momentarily.View Solution
- 8A simple pendulum is suspended from the roof of a trolley which moves in a horizontal direction with an acceleration $a$, then the time period is given by $T = 2\pi \sqrt {\frac{l}{{g'}}} $, where $g'$ is equal toView Solution
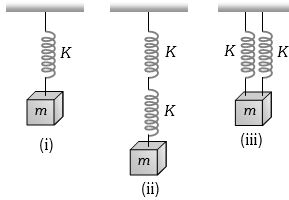
- 9View SolutionFive identical springs are used in the following three configurations. The time periods of vertical oscillations in configurations (i), (ii) and (iii) are in the ratio
- 10A vibratory motion is represented by $x = 2A\,\cos \omega t + A\,\cos \,\left( {\omega t + \frac{\pi }{2}} \right) + A\,\cos \,\left( {\omega t + \pi } \right)$ $ + \frac{A}{2}\,\cos \left( {\omega t + \frac{{3\pi }}{2}} \right)$. The resultant amplitude of the motion isView Solution