MCQ
A source of sound emits sound waves at frequency $f_0$. It is moving towards an observer with fixed speed $v_s$ ($v_s < v$, where $v$ is the speed of sound in air). If the observer were to move towards the source with speed $v_0$, one of the following two graphs ($A$ and $B$) will given the correct variation of the frequency $f$ heard by the observer as $v_0$ is changed The variation of $f$ with $v_0$ is given correctly by
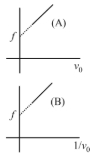
- Agraph $A$ with slope $ = \,\frac{{{f_0}}}{{\left( {v + {v_s}} \right)}}$
- Bgraph $B$ with slope $ = \,\frac{{{f_0}}}{{\left( {v - {v_s}} \right)}}$
- ✓graph $A$ with slope $ = \,\frac{{{f_0}}}{{\left( {v - {v_s}} \right)}}$
- Dgraph $B$ with slope $ = \,\frac{{{f_0}}}{{\left( {v + {v_s}} \right)}}$